2020 Annual Report
Business Openings Recover, Reopenings Rise, and Changes in Consumer Interest Indicate a Return to Pre-Pandemic Activities, According to Yelp Economic Average
For the Annual 2020 Yelp Economic Average report, we’re using a new methodology that tracks several indicators on a daily basis. For more on the methodology for this report, click here.
Last year was full of unexpected challenges and local businesses served as a mirror for the fluctuations that defined the U.S. economy. In our previous Yelp Economic Average reports in Q2 and Q3, we reported on business closures across the country and the resilience of local businesses evidenced through new openings and reopenings, respectively. While the pandemic continues to drive uncertainty in the economy, Q4 data demonstrates early evidence of an economic recovery.
To conclude the year, we’ve extended our analysis on the openings and reopenings of local businesses during yet another wave (the highest on record) of COVID-19 cases across the nation, noting a sustained volume of both measures through Q4. Business owners had nearly nine months of experience operating during the pandemic and were better prepared to adapt their businesses amidst the new set of local restrictions. Similarly, consumers have adjusted to the ‘new normal,’ showing restraint in their vacation plans, displaying an increased interest in non-traditional wedding celebrations, and learning how to adapt their weekend plans to meet their COVID-safe lifestyle.
Food and Restaurant Openings Were Down in 2020, but Had Mostly Recovered by Q4
In Q3, we observed restaurant and food businesses open at pre-pandemic levels, due largely to the innovative ways business owners moved their operations outside during the milder months and prioritized opening less traditional food services – such as farmers markets and food trucks.
Opening a business amidst an international pandemic is no easy feat, especially when the virus is airborne and the business is a restaurant. Entrepreneurs in the restaurant and food categories focused on health and safety, as well as new approaches to serve their customers, such as takeout and outdoor dining.
Yelp’s data indicates that the number of restaurant and food business openings approached and even surpassed 2019 levels in Q4. Openings are determined by counting new businesses listed on Yelp. Restaurant and food business owners opened 18,207 restaurants nationwide in Q4, down only 4% from Q4 2019 – and down only 16% comparing the full year of 2020 to 2019. In October 2020, 12 more restaurants were opened than in October of 2019.
New openings were up year-over-year, in Q4, for grab-and-go food services including: food trucks (1,507 openings), desserts (1,410 openings), gourmet food stores (955 openings), and bakeries (913 openings).
New Restaurant and Food Businesses Are Opening Near Pre-Pandemic Levels
New restaurant and food business openings*, 2016–2019 vs. 2020
Home, Professional, and Local Services Openings Suffered in Q2, but Recovered by the End of the Year
Beyond the resilience we’re seeing in restaurants and food businesses, entrepreneurs across categories displayed tenacity by starting new home, local, professional, auto, retail, fitness and beauty businesses in Q4, revealing both the struggle of local economies as well as promising signs of recovery. Yelp compared monthly openings in 2020 to openings in 2019 for some of the most popular categories to determine the level of recovery in the industry.
Home and professional services proved to be the most resilient and poised for growth throughout the pandemic. In April, openings dropped by only 4% for home services and 6% for professional services compared to April 2019, the smallest decreases of major categories on Yelp. Throughout the remainder of the year (May through December), home services and professional services had an average increase in openings of 7% and 4%, respectively, from the same periods in 2019. Consumers have spent the majority of 2020 at home, causing many people to update and improve their spaces, and in Q4 landscaping (3,123 openings), painters (2,789 openings), handymen (2,242 openings), and flooring businesses (1,319 openings) experienced the highest openings. Meanwhile, in Q4, professional services categories that experienced the highest openings include: office cleaning (2,939 openings), business consulting (1,017 openings), and graphic design (925 openings).
Local and auto services experienced less severe declines upon the onset of the pandemic, with their sharpest decline of openings in April for local services (17% decrease) and May for auto services (21% decrease). New openings in auto services experienced an average decrease of 11%, year-over-year, until September (7% increase year-over-year), coinciding with auto sales increasing. While new auto services openings decreased in October and November, recovery was evident in December, as auto services had 14% more openings than December 2019. Auto service categories with increased openings in Q4 2020 compared to prior years included businesses related to regular vehicle maintenance such as detailing (1,705 openings), car washes (929 openings), and oil changes (444 openings). Local services experienced new opening decreases through August, but starting in September openings increased by 13% year-over-year and continued to show a strong recovery in Q4 with an 10% average monthly increase in openings compared to Q4 2019. Junk removal (1,609 openings), notaries (1,380 openings), IT services (1,360 openings), nonprofits (749 openings), and self-storage (519 openings) all experienced an increase in new openings in Q4 2020, compared to the year prior.
Retail and shopping businesses averaged approximately 3,118 openings per month in 2020, a 25% decrease from 2019 where the category averaged 4,175 openings per month. The industry experienced its highest number of business openings since February in October, followed by a slow down of new openings in November and December. Cellphones and accessories (606 openings), gardening (199 openings), spiritual shops (101 openings), and bikes (87 openings) experienced increased openings in Q4 2020 compared to 2019.
Prior to the pandemic, fitness and beauty categories flourished averaging 1,086 openings and 3,843 openings per month in 2019, respectively, up from the average monthly openings in prior years. After a significant drop in new openings in April (down 64% for fitness and down 66% for beauty compared to April 2019), new openings began to recover in Q4. Similar to retail and shopping, since February 2020, both fitness and beauty industries experienced their highest number of new openings in October with 845 and 3,804 new business openings, respectively, (down 26% and 11% year-over-year). As cases continued to increase, new openings slowed in November and December. Historically, fitness and beauty categories experience a decrease in openings in December; the decrease in November coincides with increased COVID-19 cases across the nation. In Q4 2020, golf lessons (62 openings) was the only fitness category to increase new openings compared to 2019. Meanwhile, the majority of fitness business openings in the quarter were health trainers (818 openings) and yoga studios (415 openings). Additionally, several beauty categories experienced increased openings in Q4 2020 compared to 2019 including, nail technicians (324 openings), teeth whitening (138 openings) and sugaring (65 openings).
New Businesses Are Opening Across Categories
Home, local, professional and automotive services end the year with higher monthly openings than prior years
Businesses Reopened Nationwide in Q4
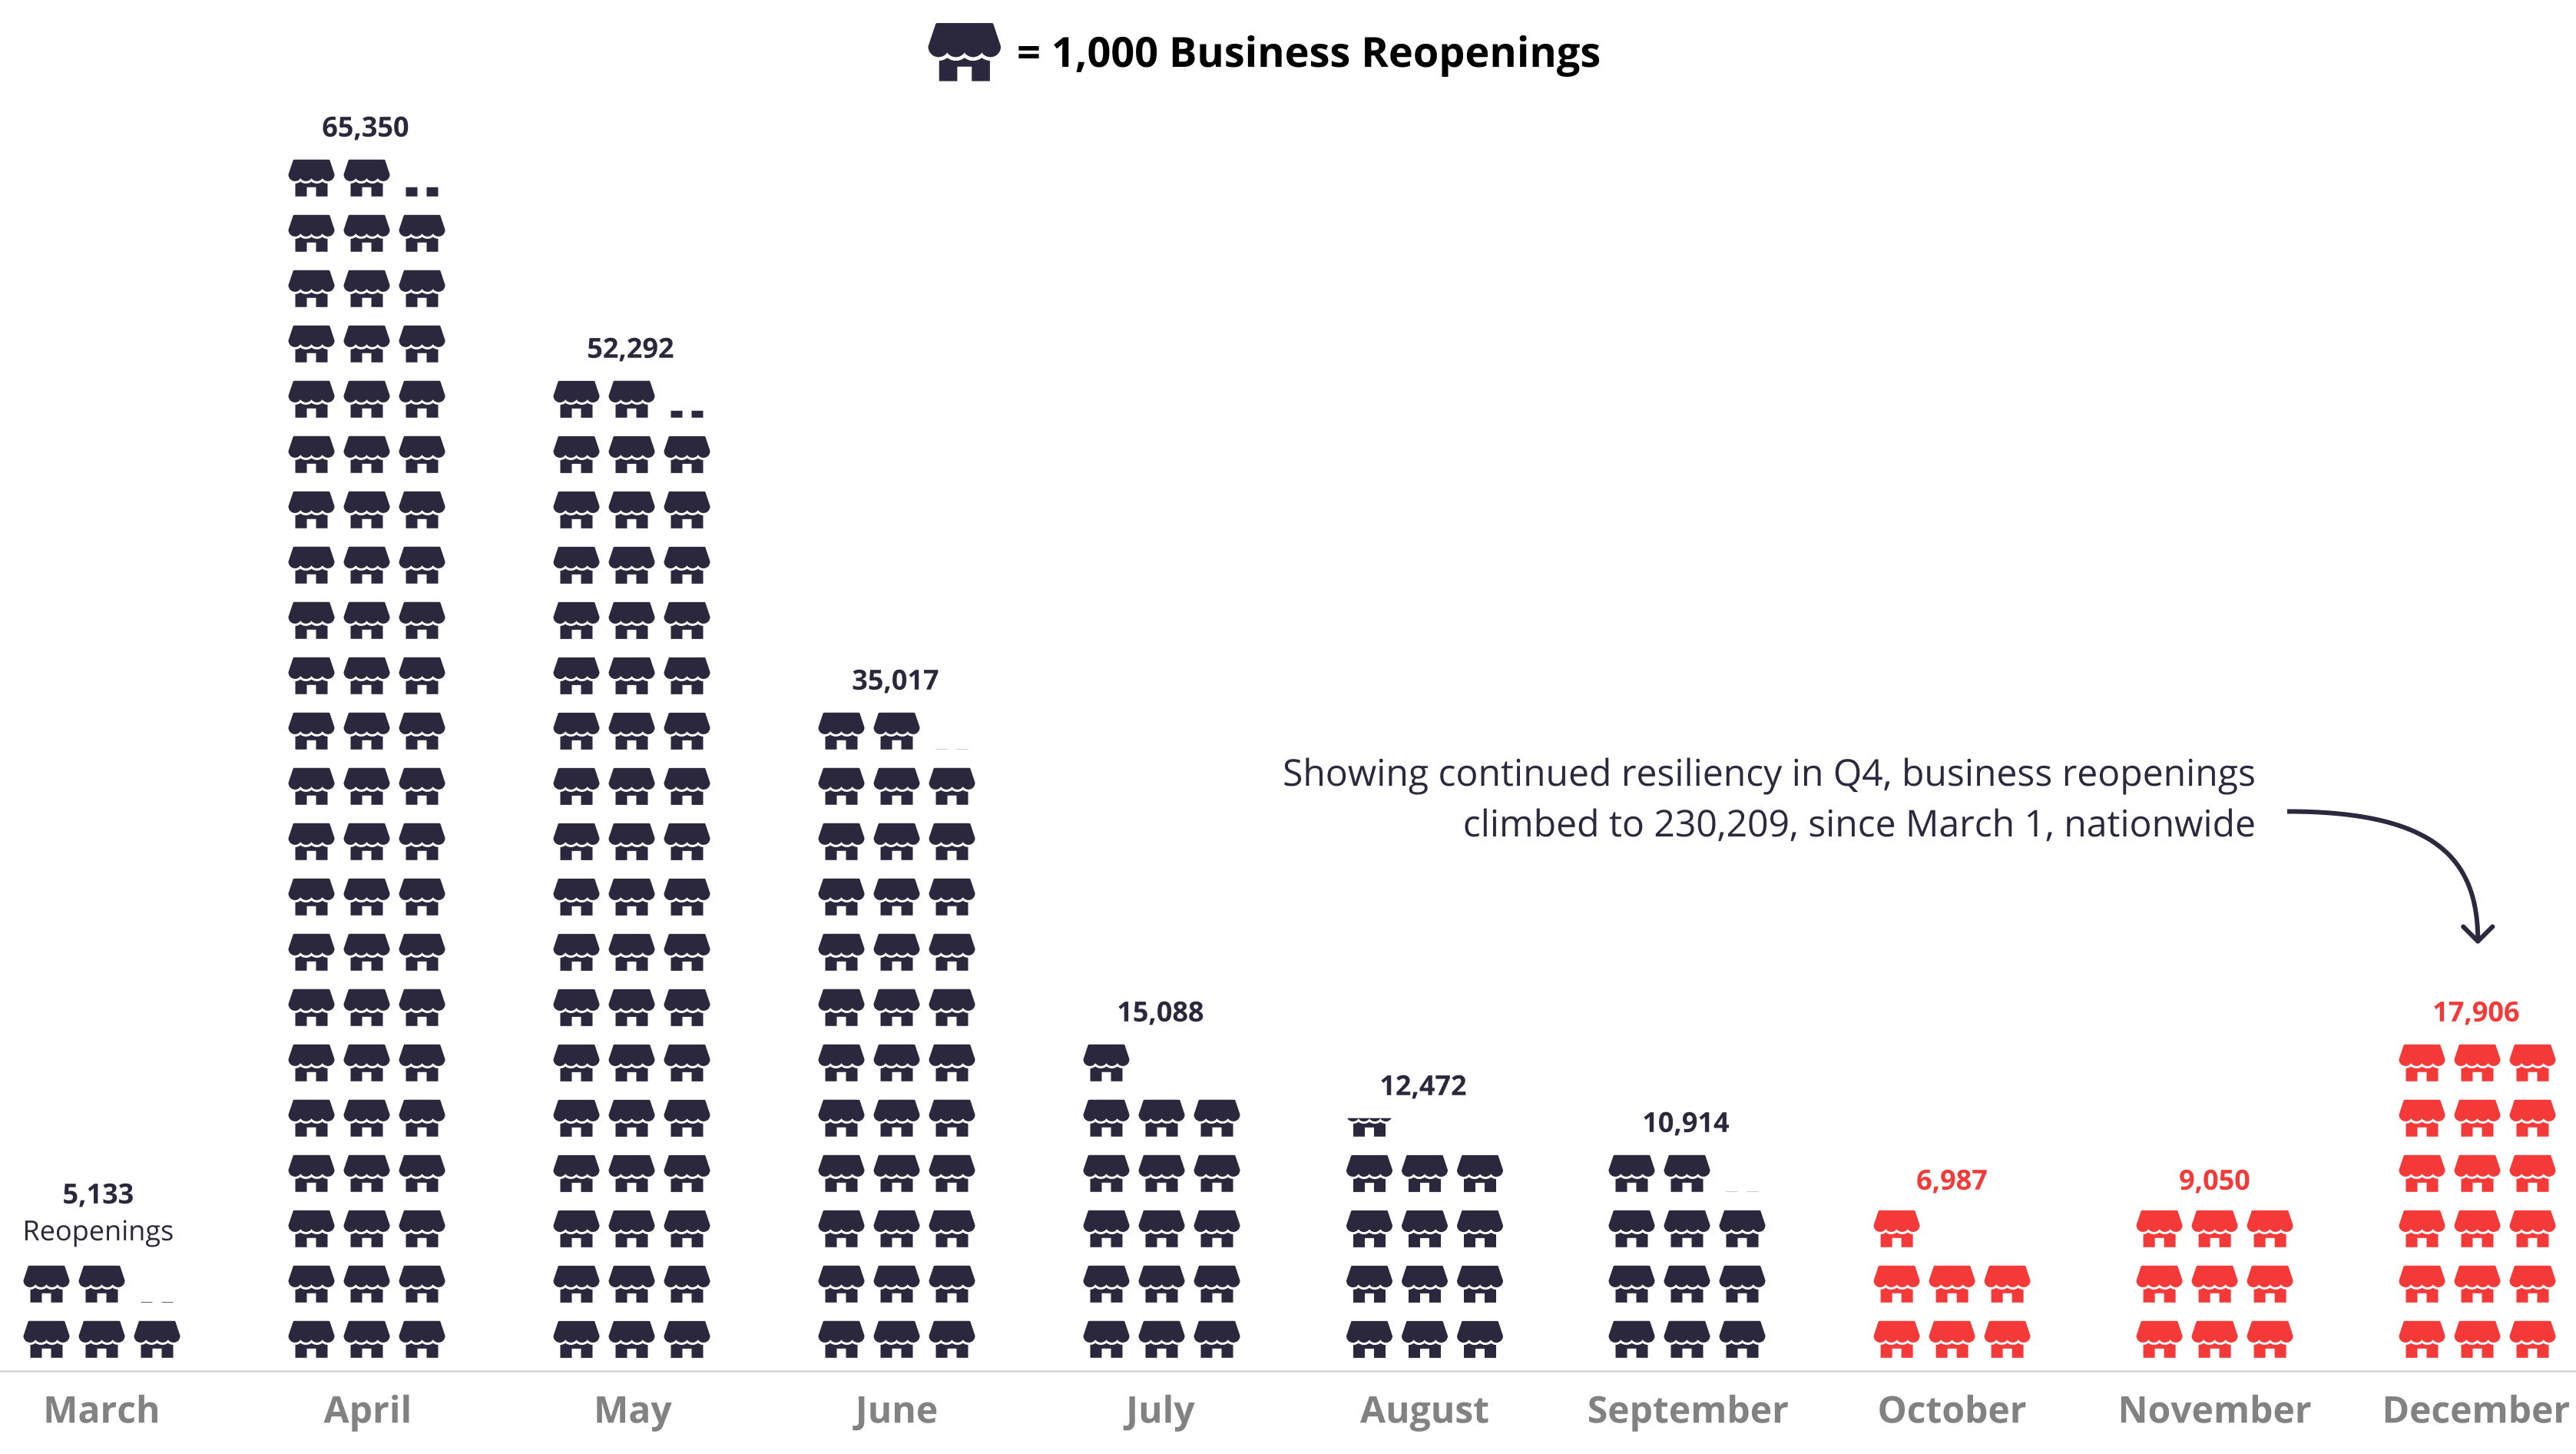
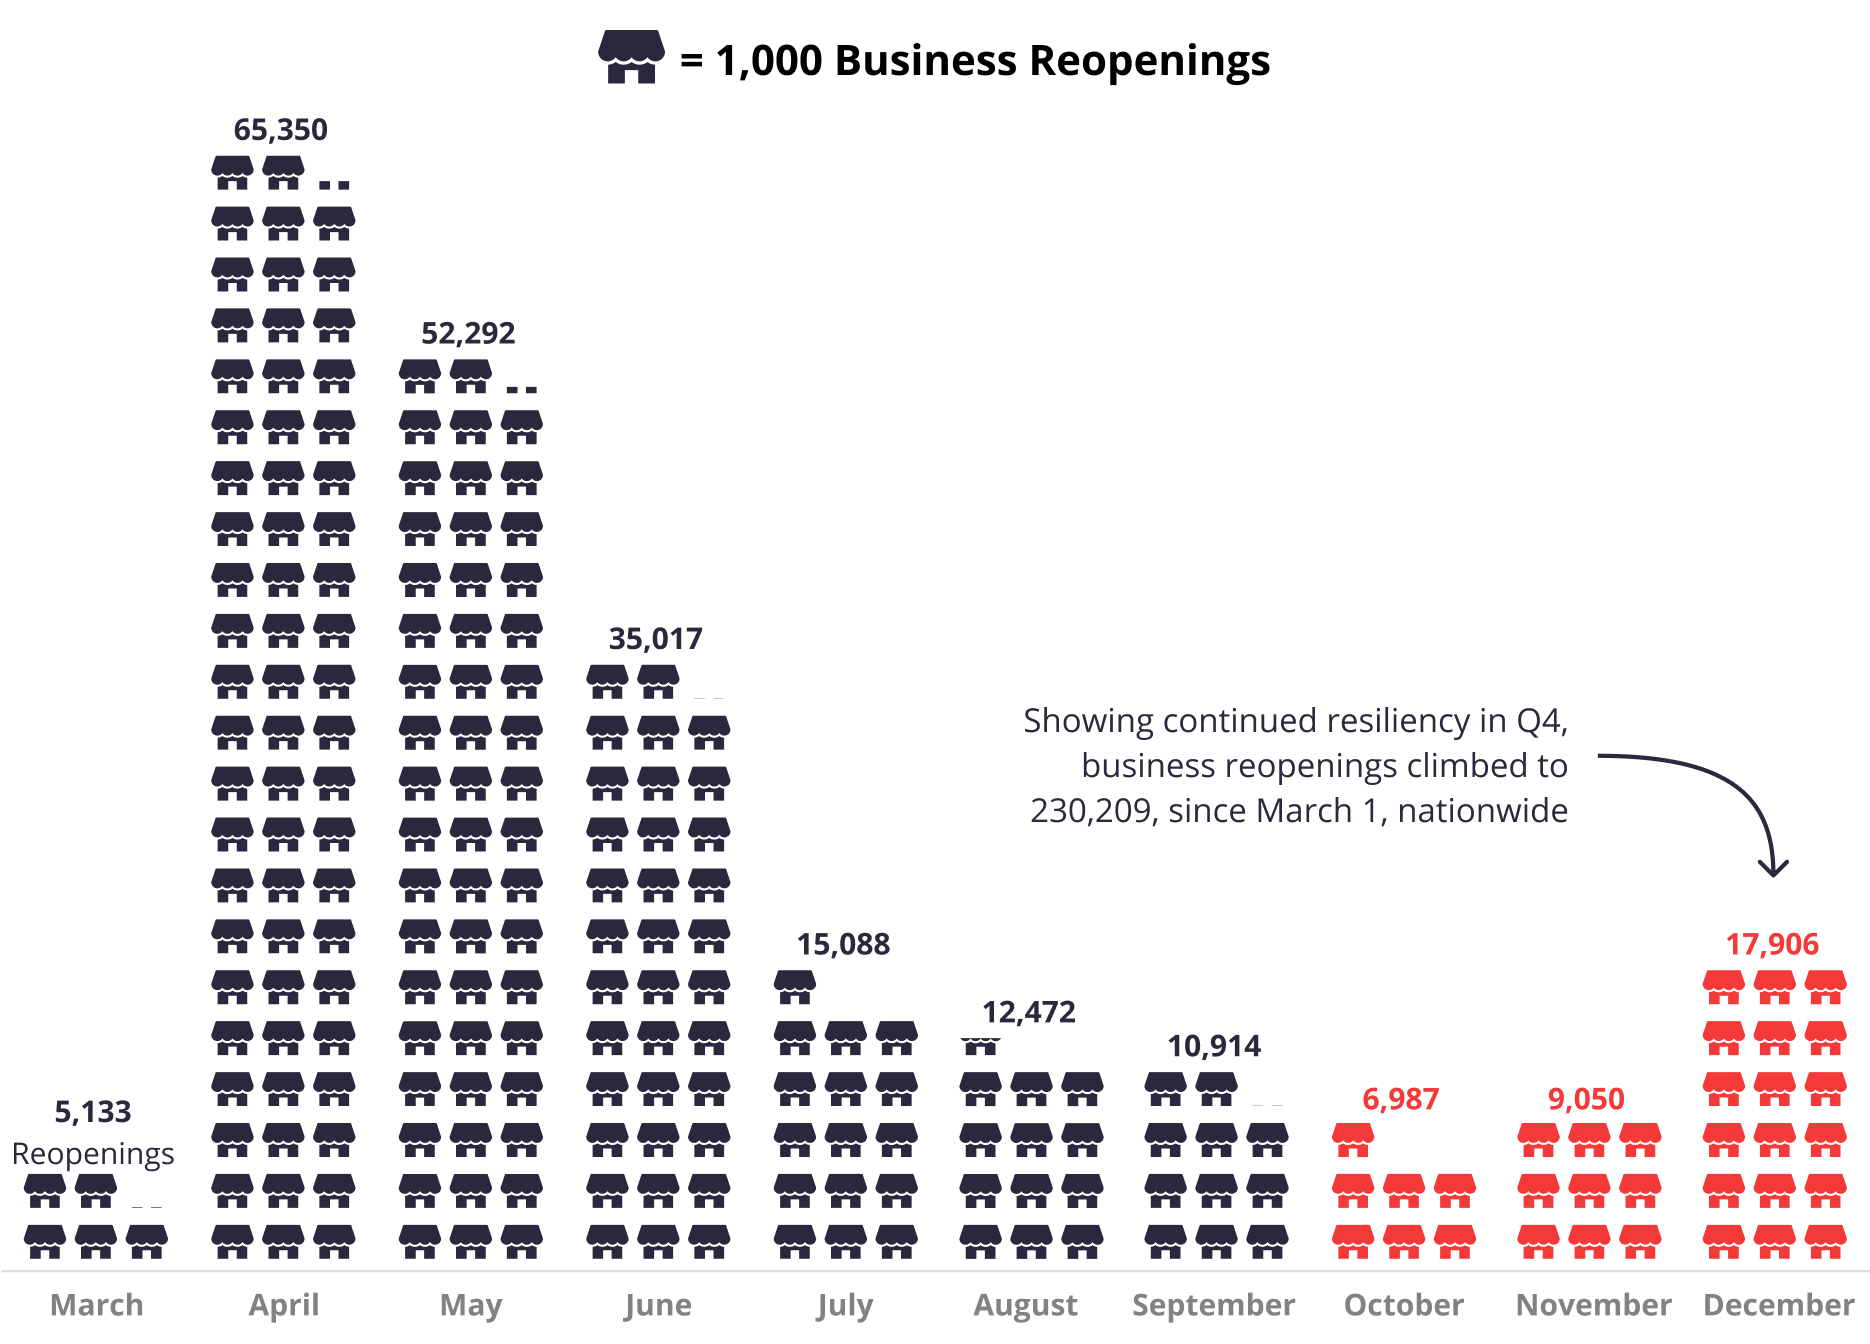
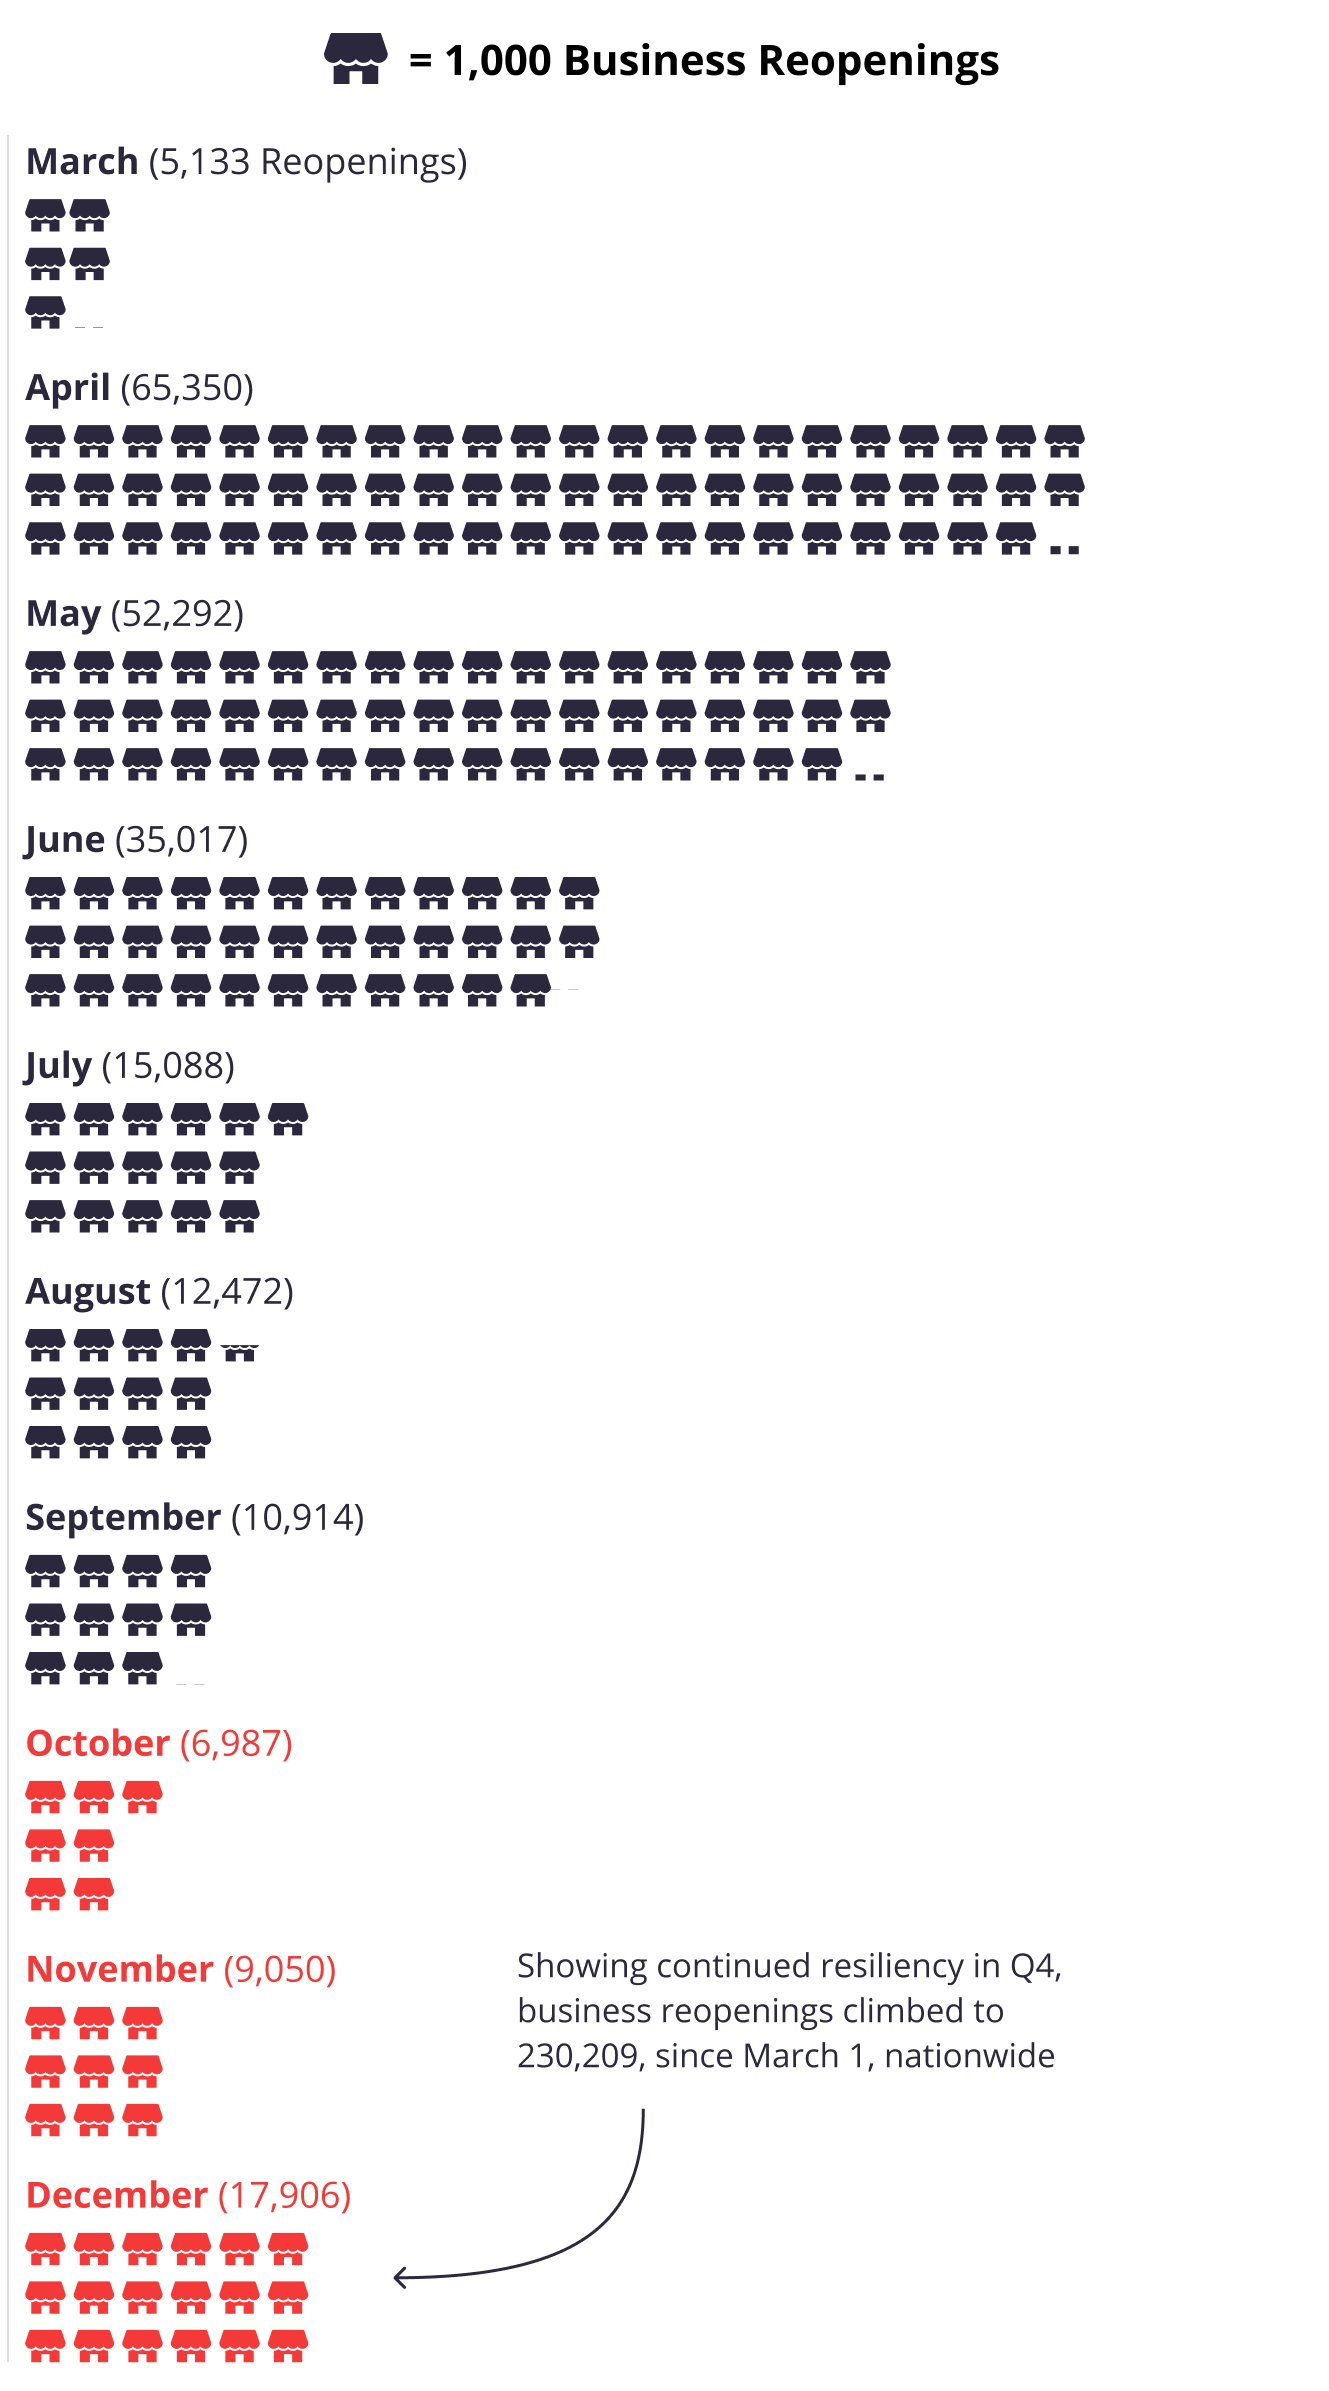
Repeated temporary closures and subsequent reopenings occurred throughout the year as local regulations changed, stay-at-home orders were instated and lifted, streets closed to encourage pedestrian traffic in many metropolitan areas, and entrepreneurs moved operations outdoors. In the Q3 Yelp Economic Average, we reported 210,000 reopenings nationwide, as of September 30. In a show of continued resiliency, amidst skyrocketing cases in Q4, the total climbed to 230,209 national reopenings between March 1 and December 31.
Reopenings slowed in October, but increased again in November and especially December, coinciding with the approval of multiple COVID-19 vaccines by the FDA. Due to the wide-ranging nature of the COVID-19 responses throughout the nation, reopenings varied across states throughout the year. The following states experienced 20% or more of their reopenings since March 1 in Q4: Wyoming (28%), Louisiana (27%), New Mexico (24%), Hawaii (21%), and California (20%).
Business Reopenings Continue Through Q4
National business reopenings* by month, Mar 2020 – Dec 2020
Reopening Resilience, When Businesses Reopen More Than Once
During the initial U.S. outbreak of the COVID-19 virus in March, business owners and consumers assumed that nationwide temporary closures would last just a few weeks before everything was “back to normal.” As the outbreak transformed into a full fledged international pandemic with waves of case volumes, business closure guidelines were lifted and restarted several times depending on the area’s infection rates.
Yelp data tracks all temporary closures of businesses and their subsequent openings, revealing that many local entrepreneurs were forced to temporarily close and reopen multiple times throughout the year. For many industries such as restaurants and food based businesses this is a costly process. Since March 1, 173,727 businesses reopened once after a temporary closure, 38,702 businesses reopened twice, and 17,780 businesses reopened three times or more. Businesses in restaurants, food, shopping, active, health, and beauty categories comprised more than 91% of the businesses that had to reopen twice and 87% of businesses that reopened three times or more.
Reopening Resilience: Many Businesses Reopened More Than Once
Number of businesses on Yelp that reopened* one or multiple times, by category
Reopenings Increase Across Restaurants, Food, Active, Financial Services, Real Estate, and Home Services Categories in the Fourth Quarter
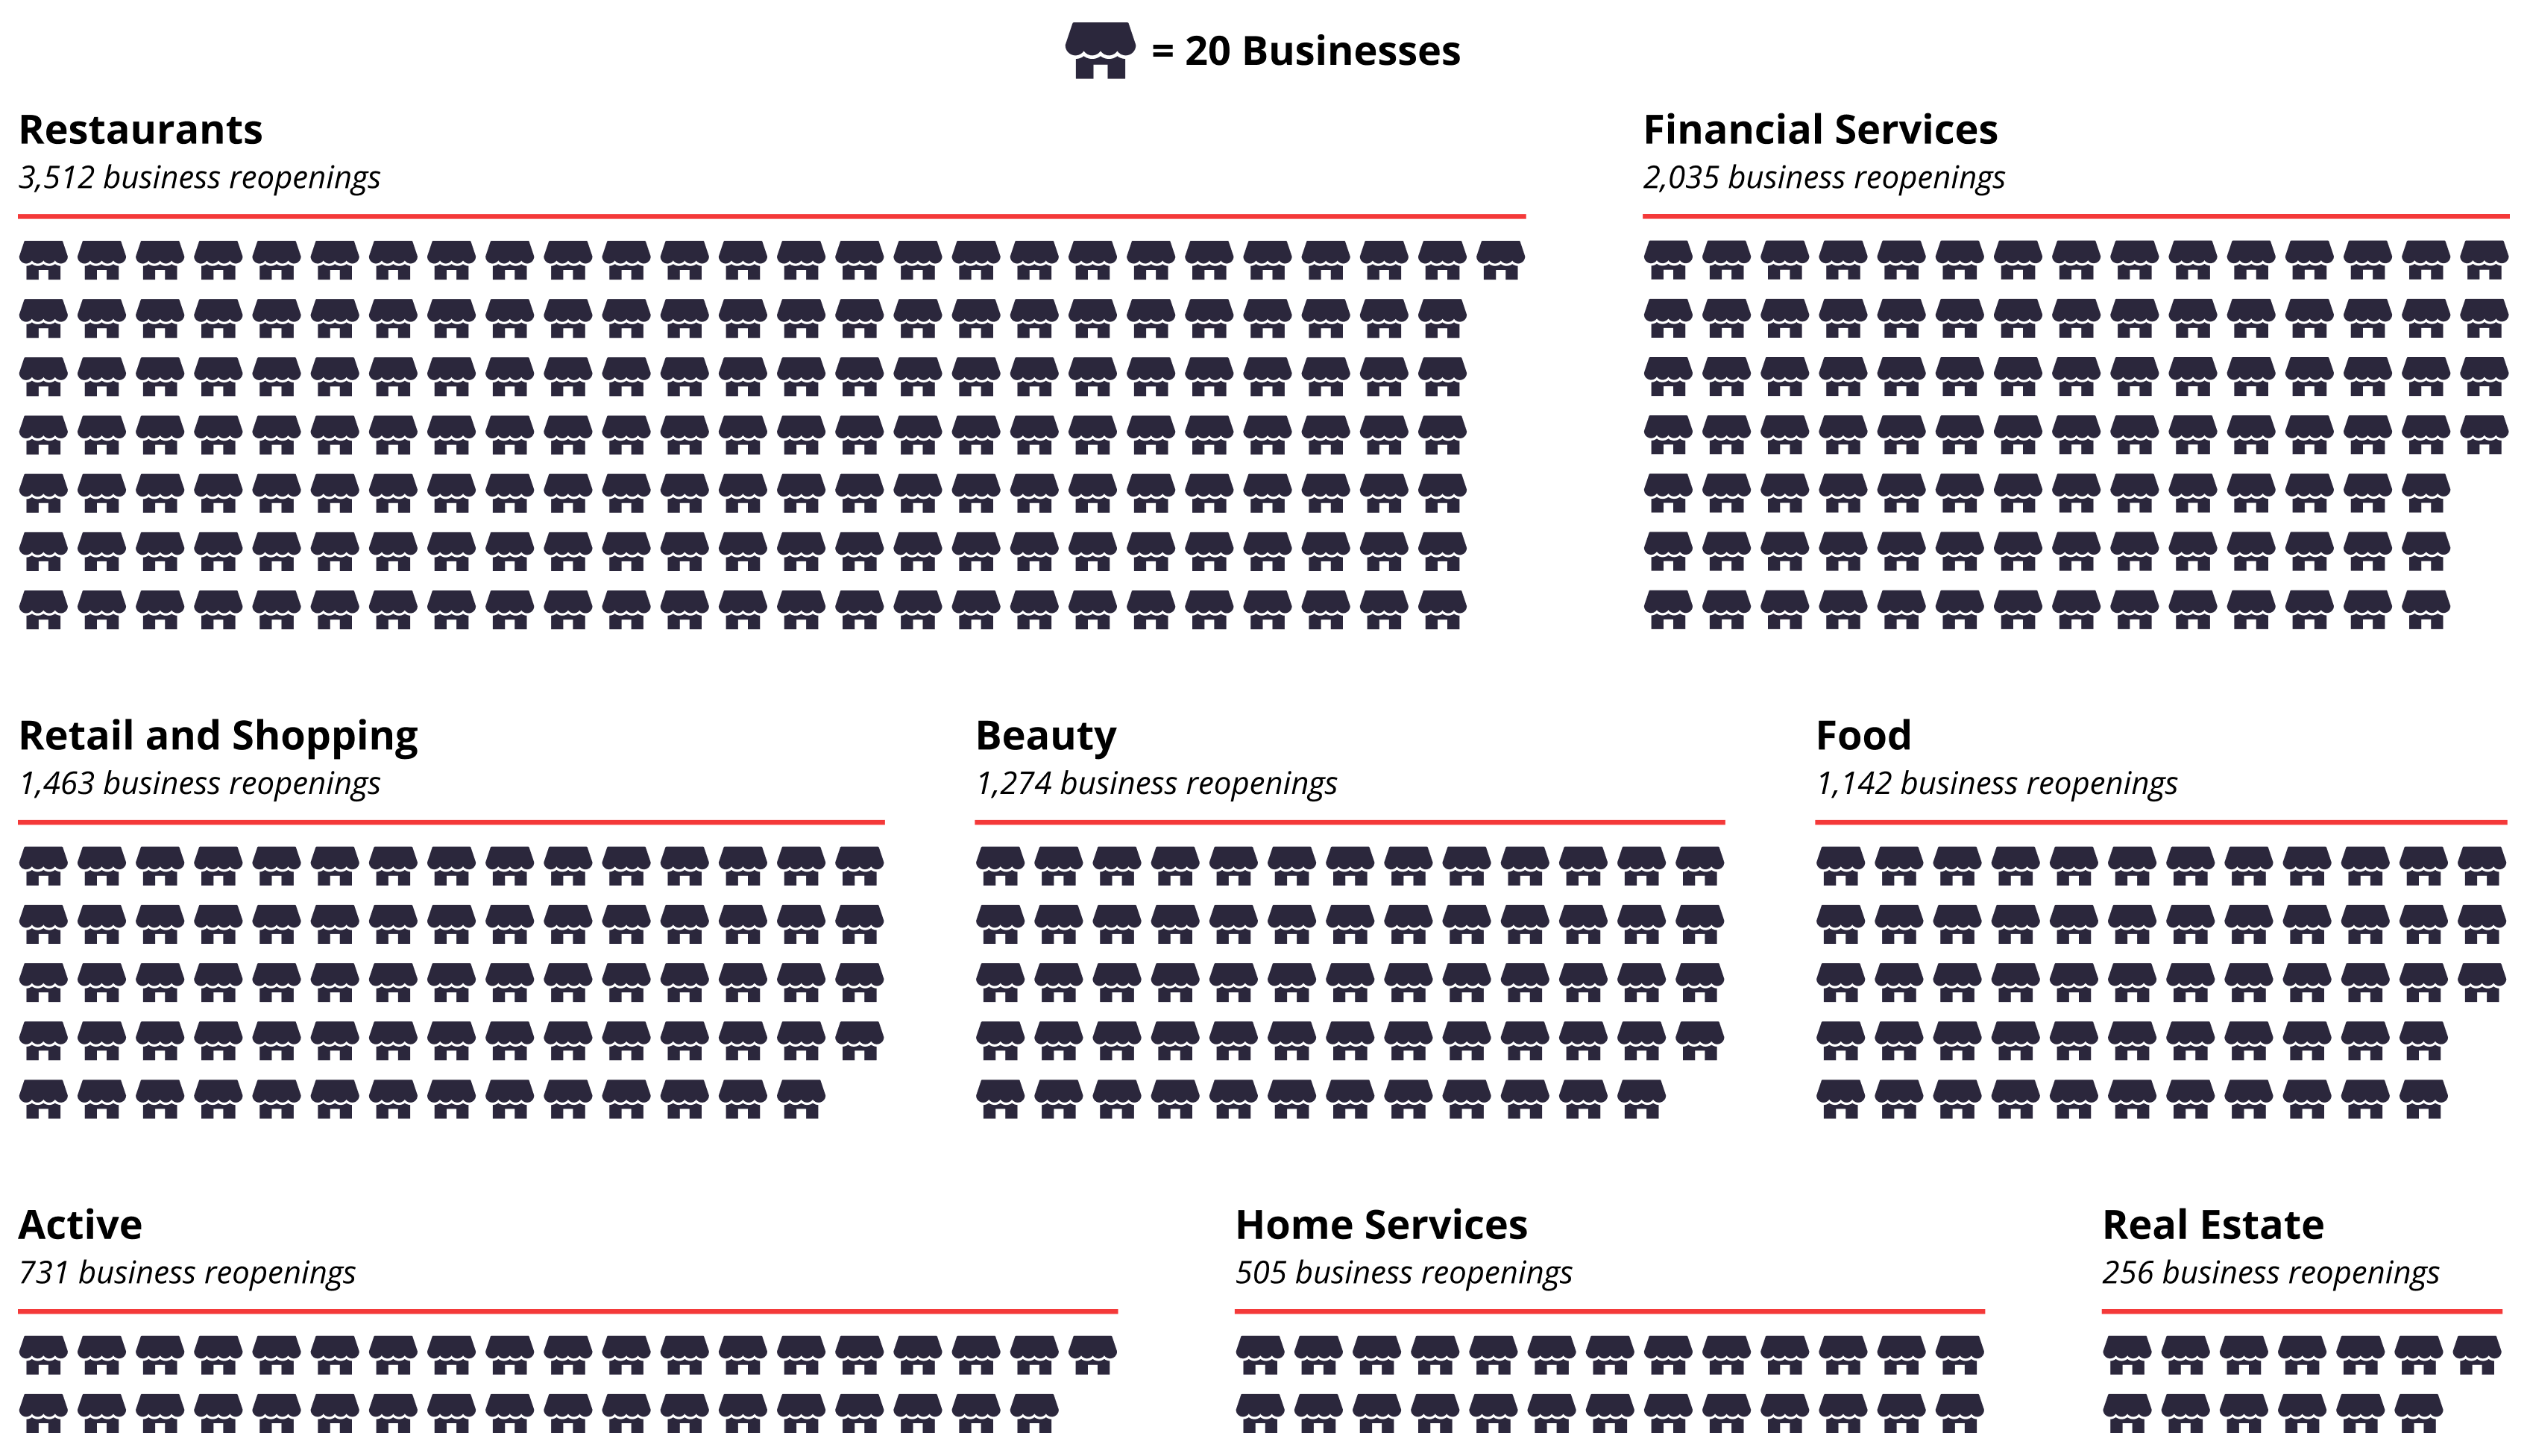
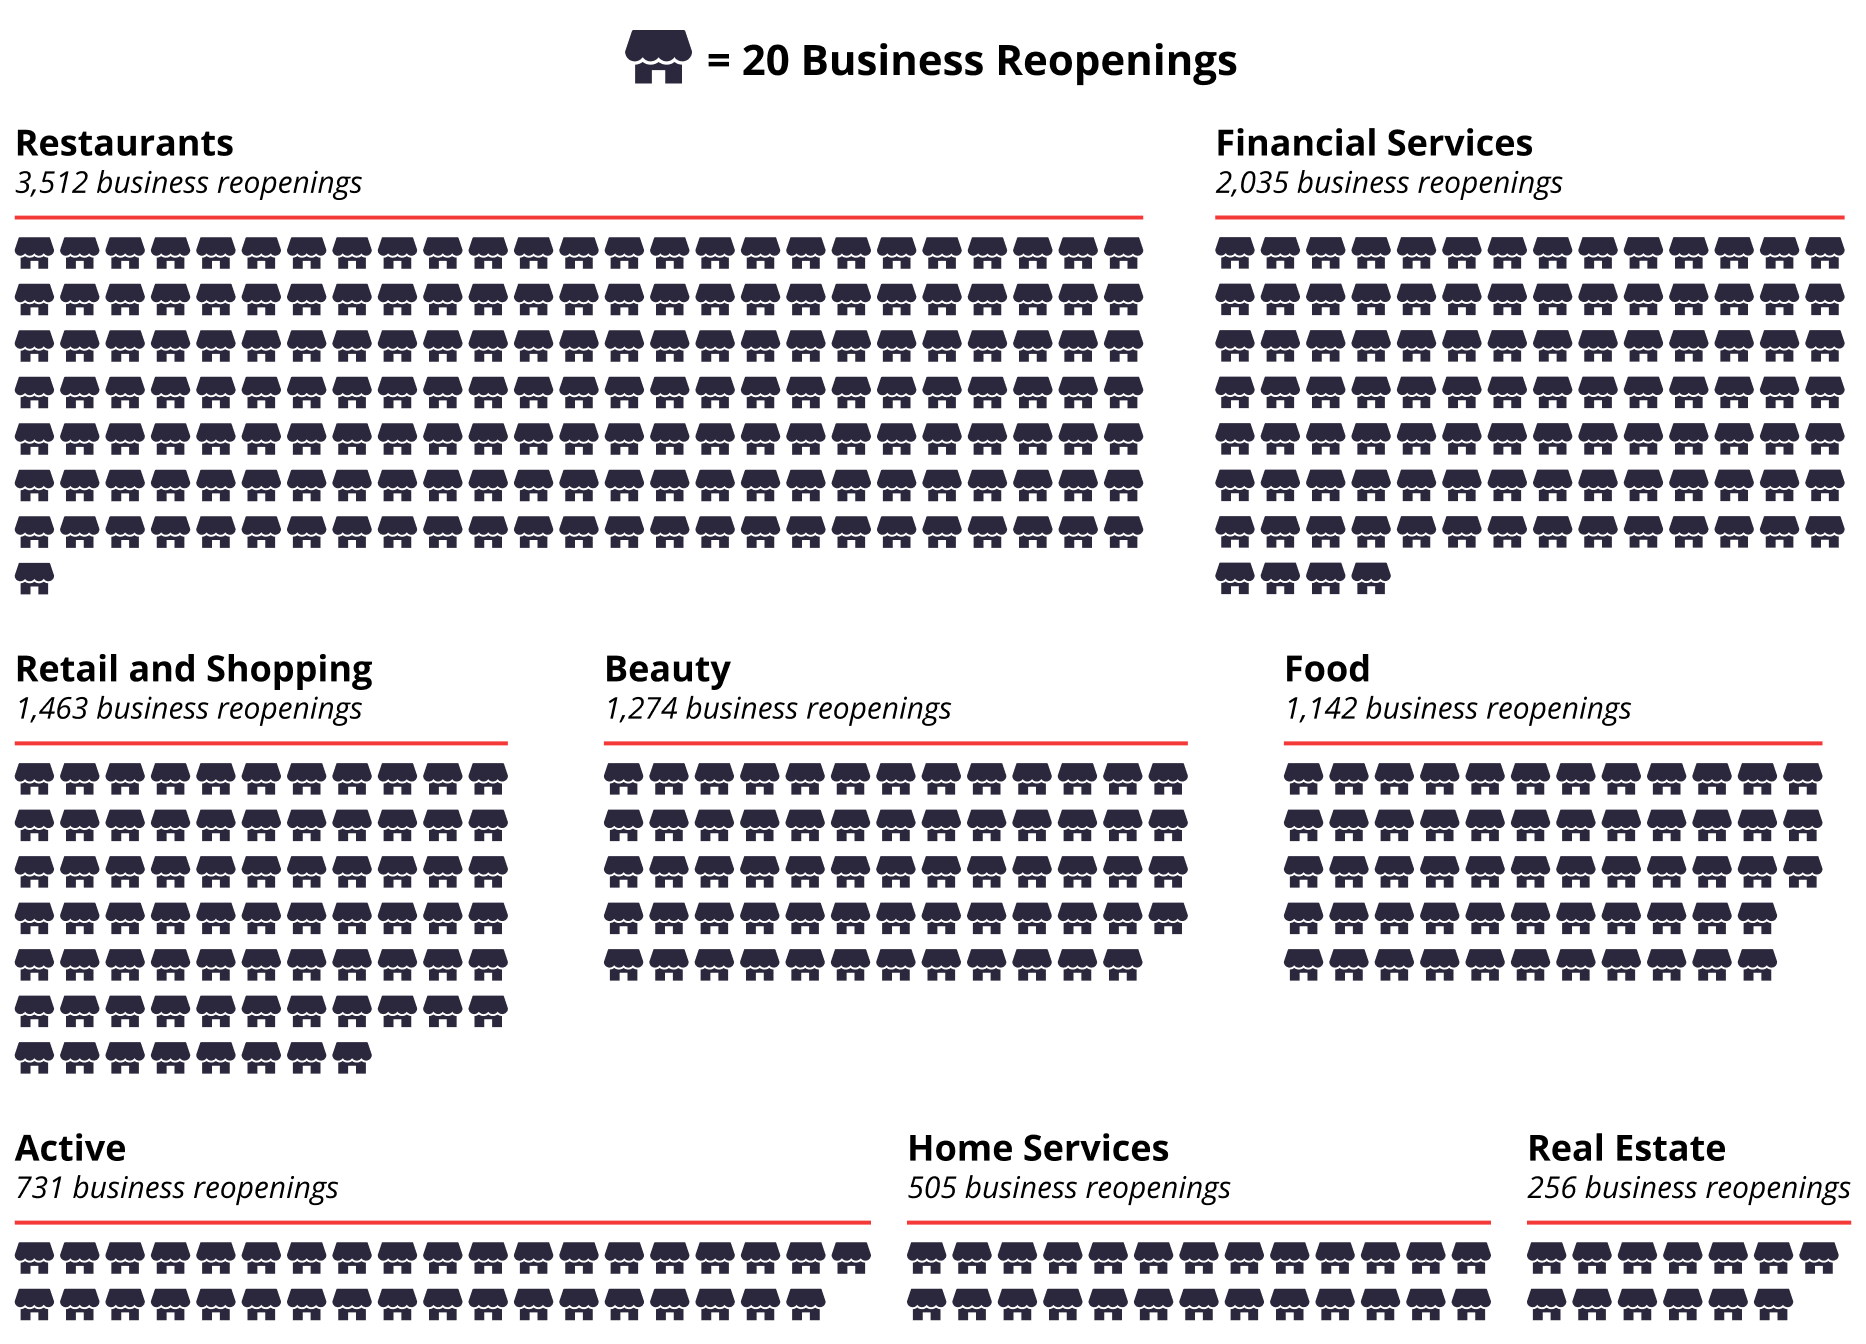
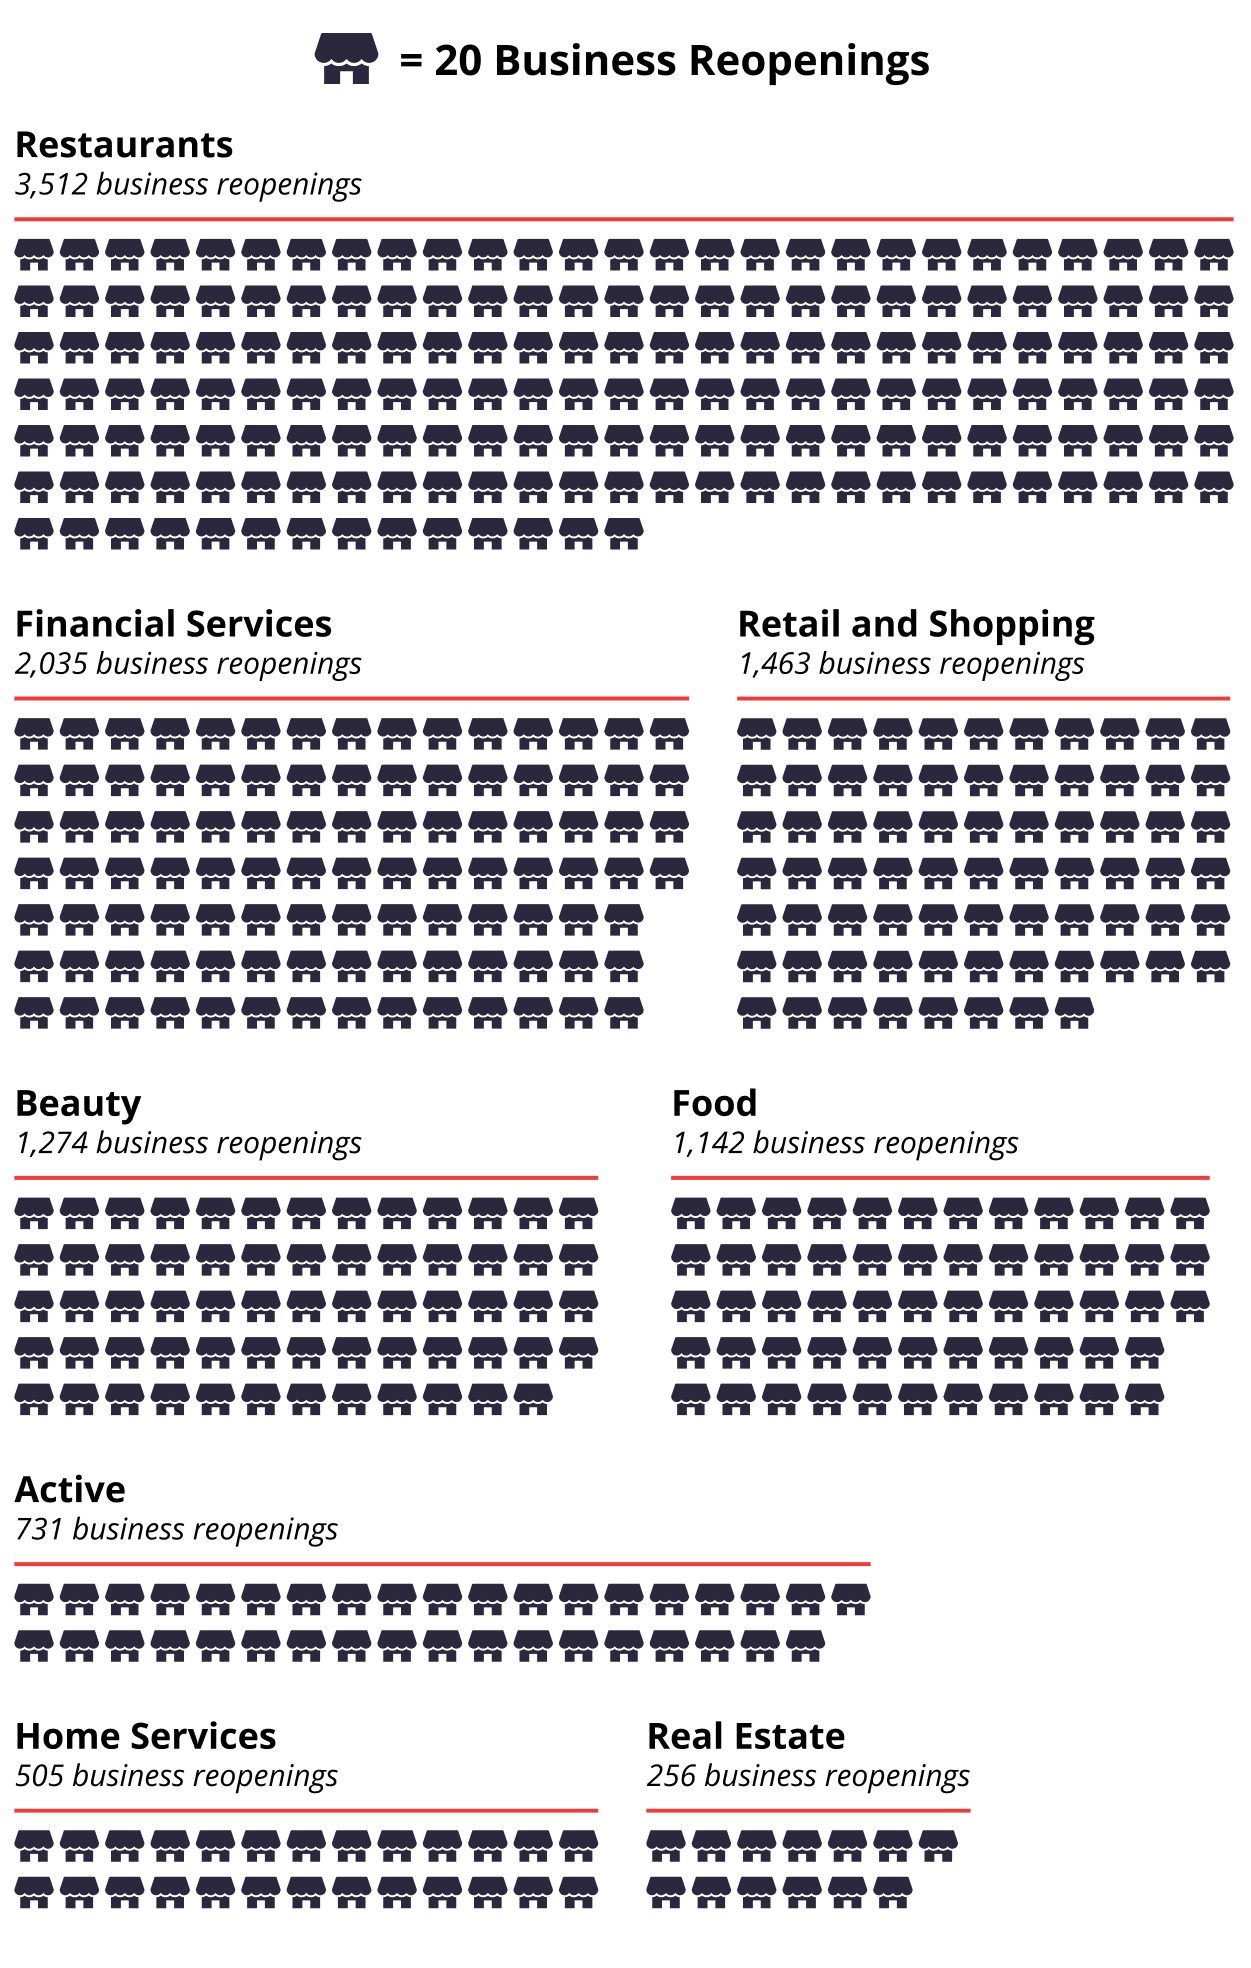
Yelp’s Q3 Yelp Economic Average report found that businesses in financial services, education, active, and beauty categories showed increased reopenings August through September. In Q4, Yelp’s reopening data reveals restaurant, food, active, professional services, and home related businesses spiked in reopenings. Despite the ongoing pandemic and surging cases, restaurants focused their operations on outdoor dining, delivery and takeout, and in some locations, indoor dining when allowed. Businesses in the restaurant and food categories had 3,512 reopenings and 1,142 reopenings in Q4, respectively.
As the New Year approached, regions with less restrictions showed increased reopenings in active categories. Businesses in the active category, such as gyms, health trainers, kids’ activities and parks, had 731 reopenings in Q4, with 381 of them in December.
With lower mortgage interest rates, Yelp’s data also shows increased reopenings in Q4 for home and professional services related to home purchases and/or home improvements including: financial services (2,035 reopenings), real estate (256 reopenings), and home services (505 reopenings). In December, 238 real estate businesses reopened, up from an average of 57 reopenings per month since March.
Businesses Reopened Across Several Major Categories in Q4
Total business reopenings* by category, Oct 2020 – Dec 2020
Travel Curbs Hammered Ski and Beach Towns’ Typical Peak Seasons
Many businesses in small tourist towns rely on local tourism during peak seasons to sustain themselves throughout the year. With tourism down in 2020 and people vacationing closer to home, many small towns felt the impact. Yelp’s consumer interest data shows that areas impacted the most during 2020 were primarily within four categories: ski towns, beach towns, event locations, and Hawaii destinations.
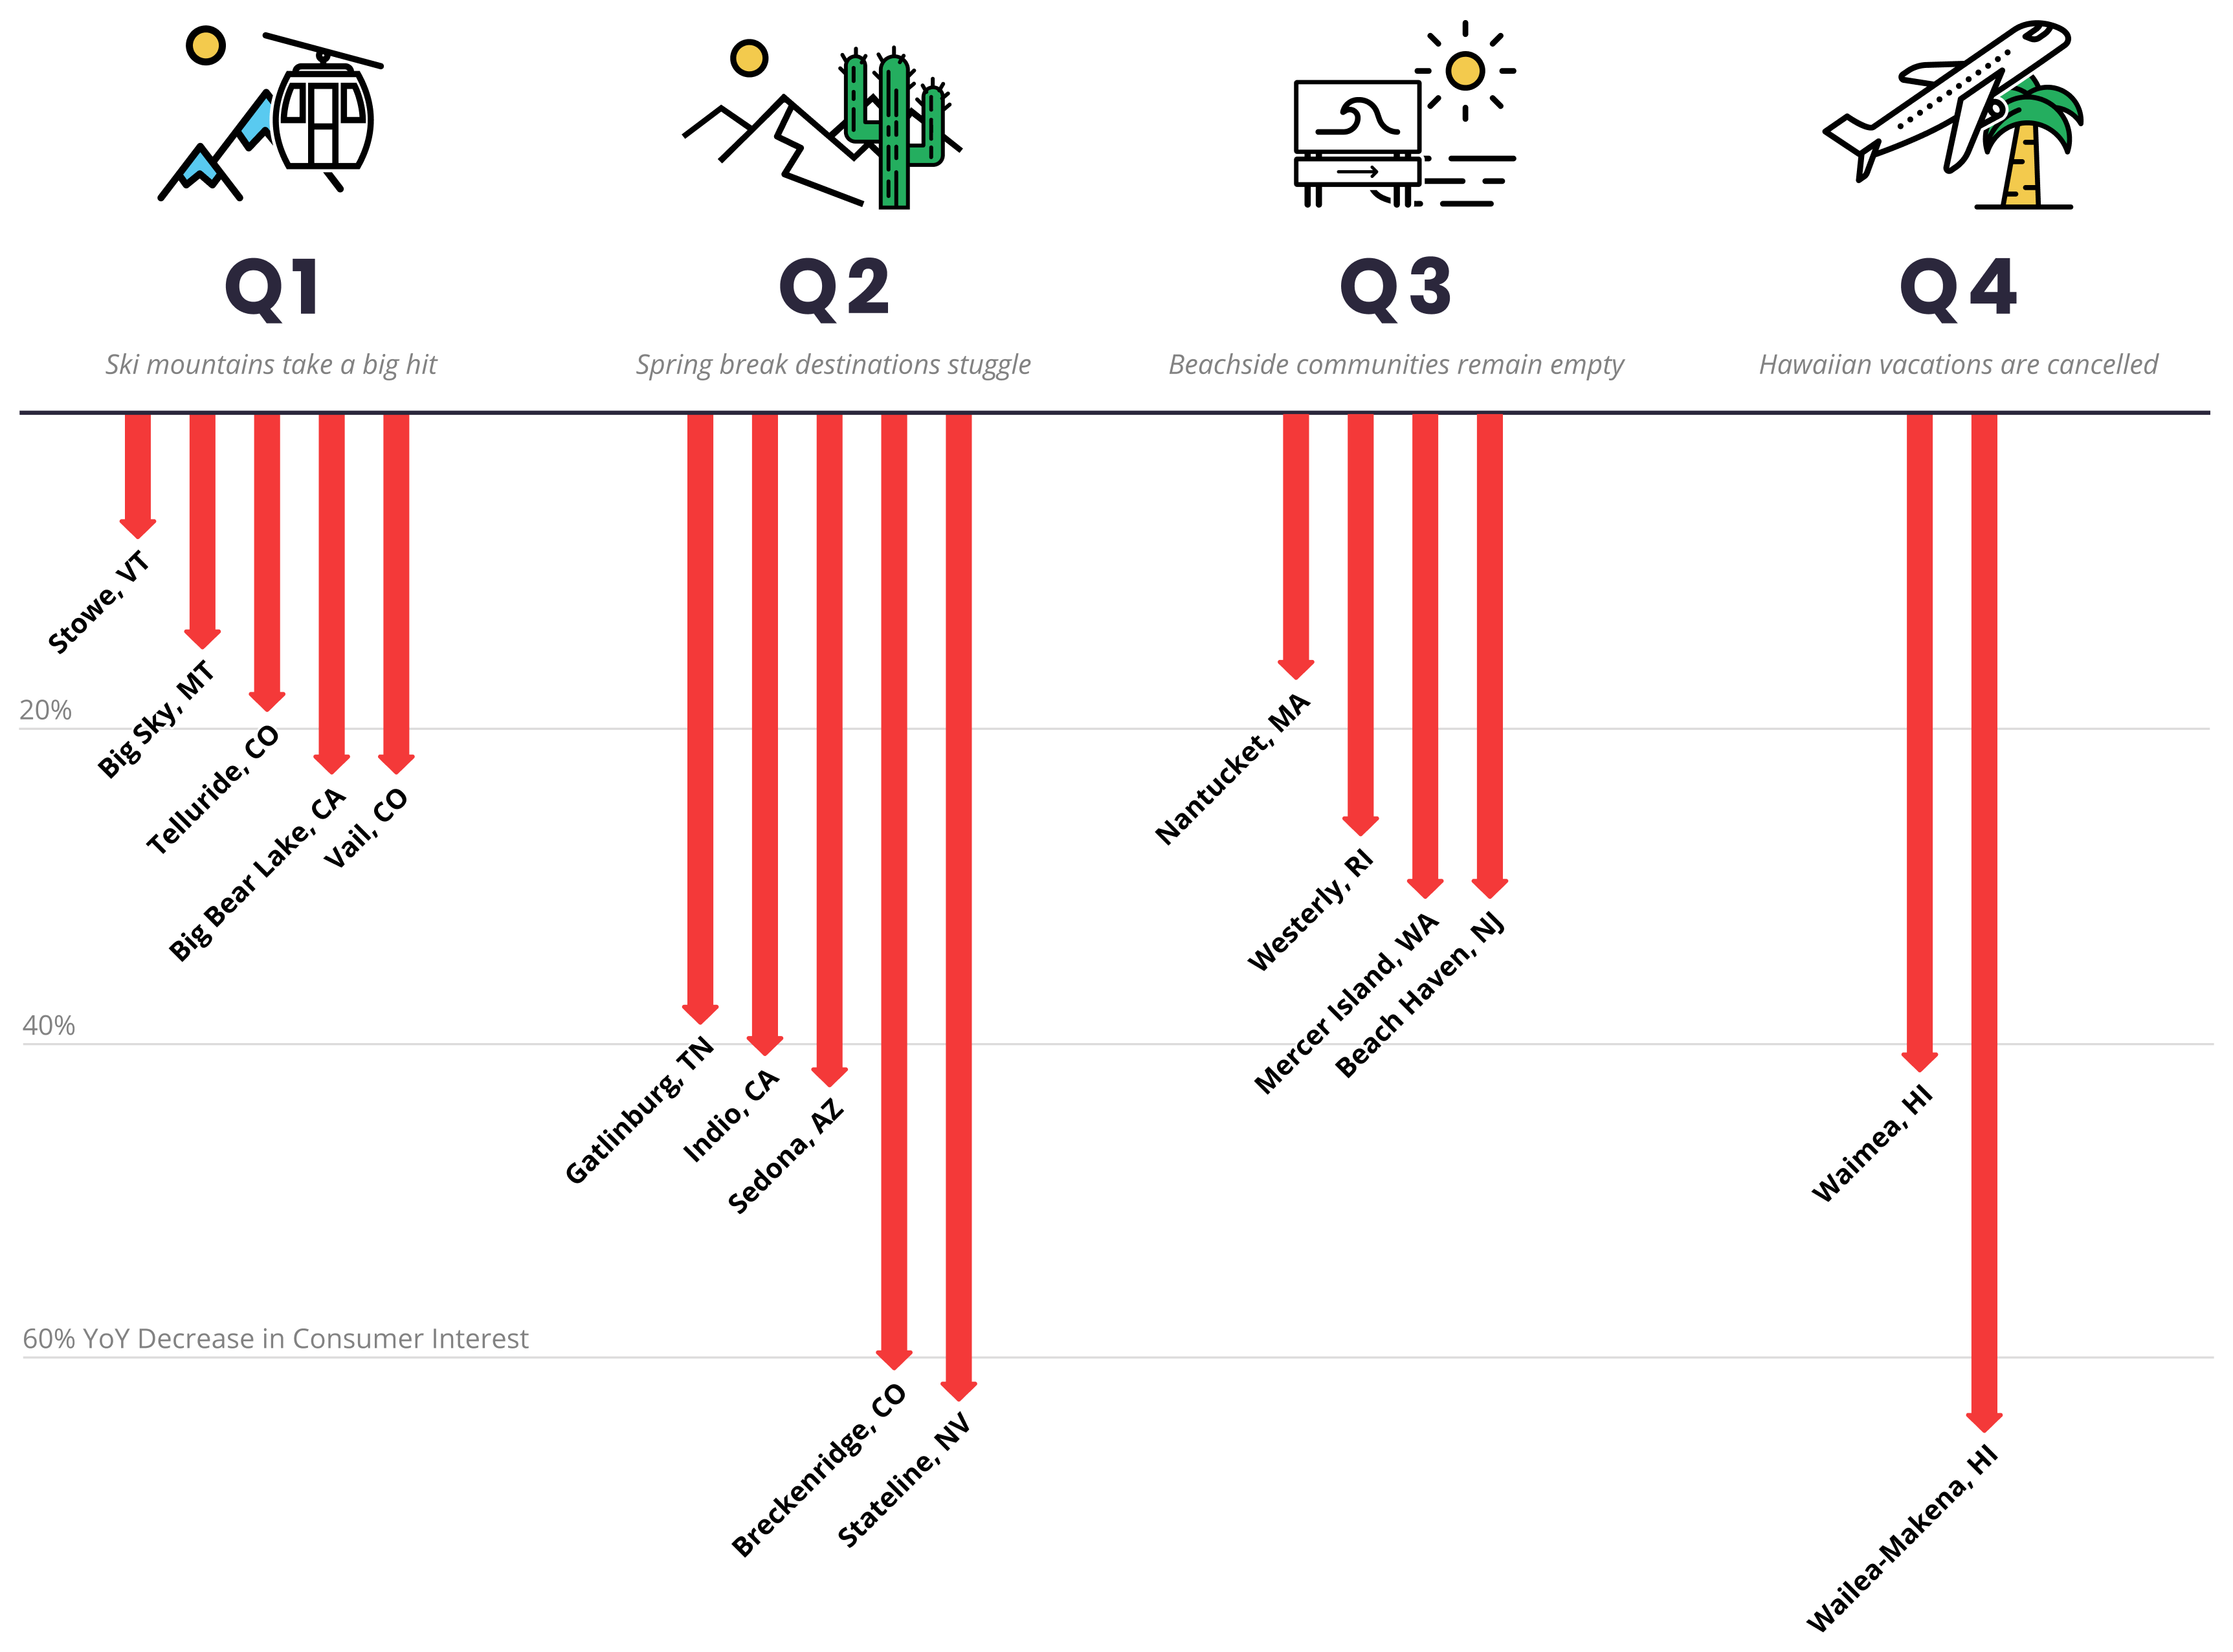
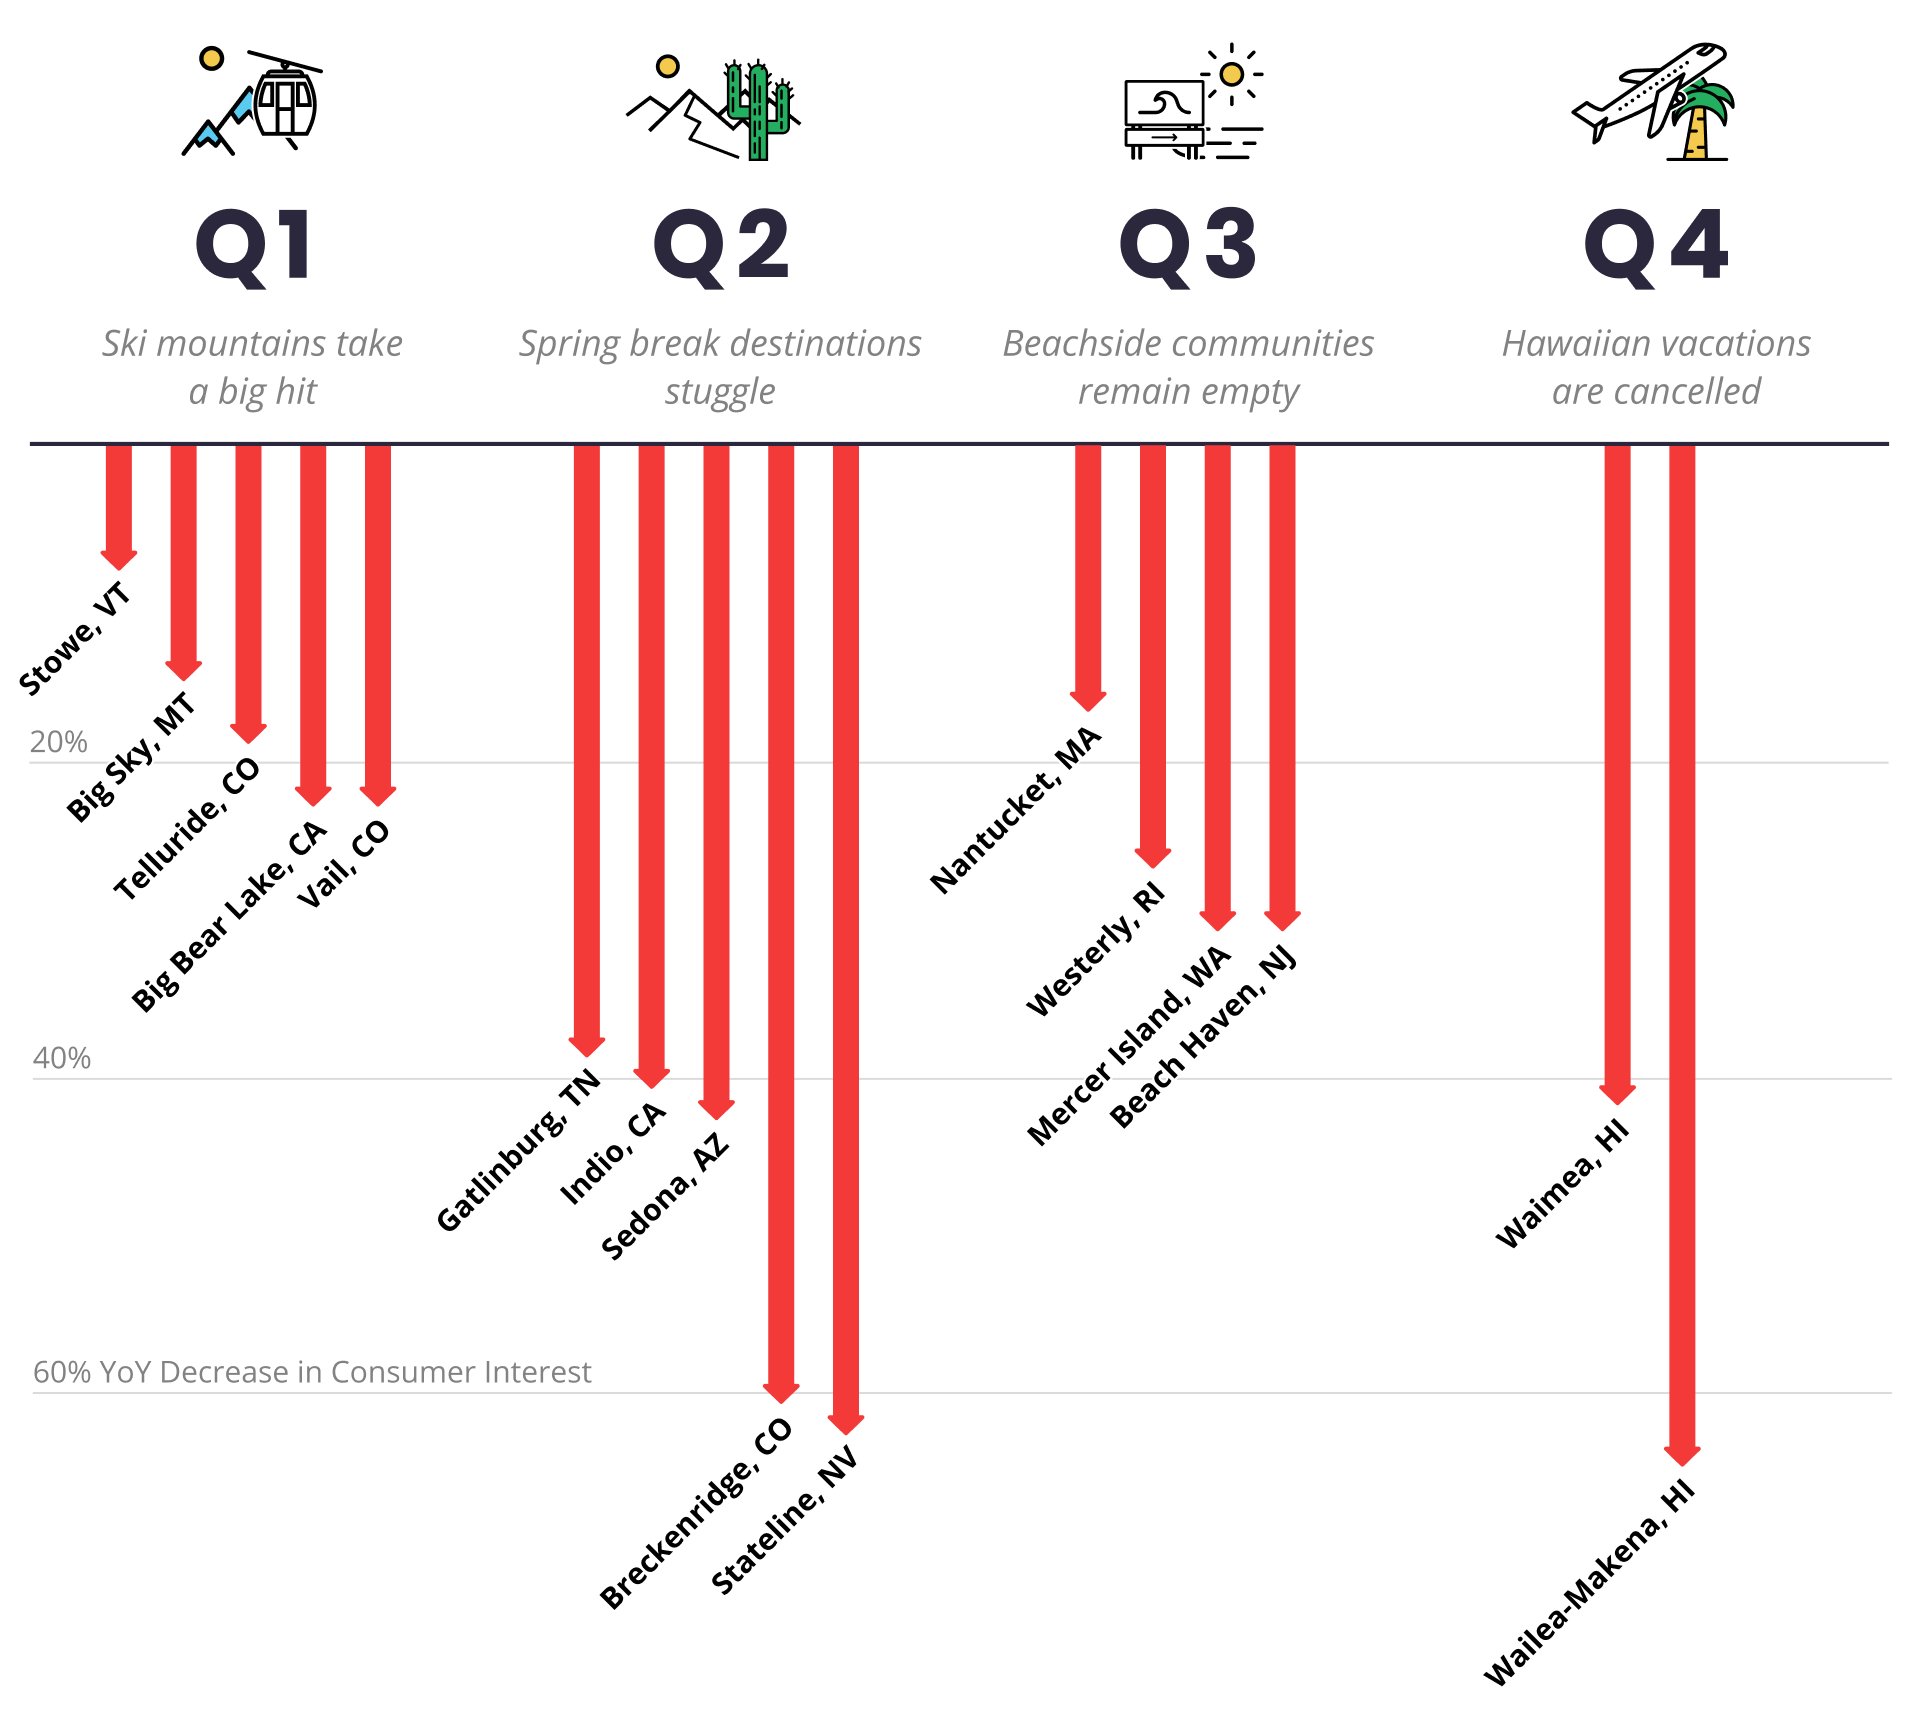
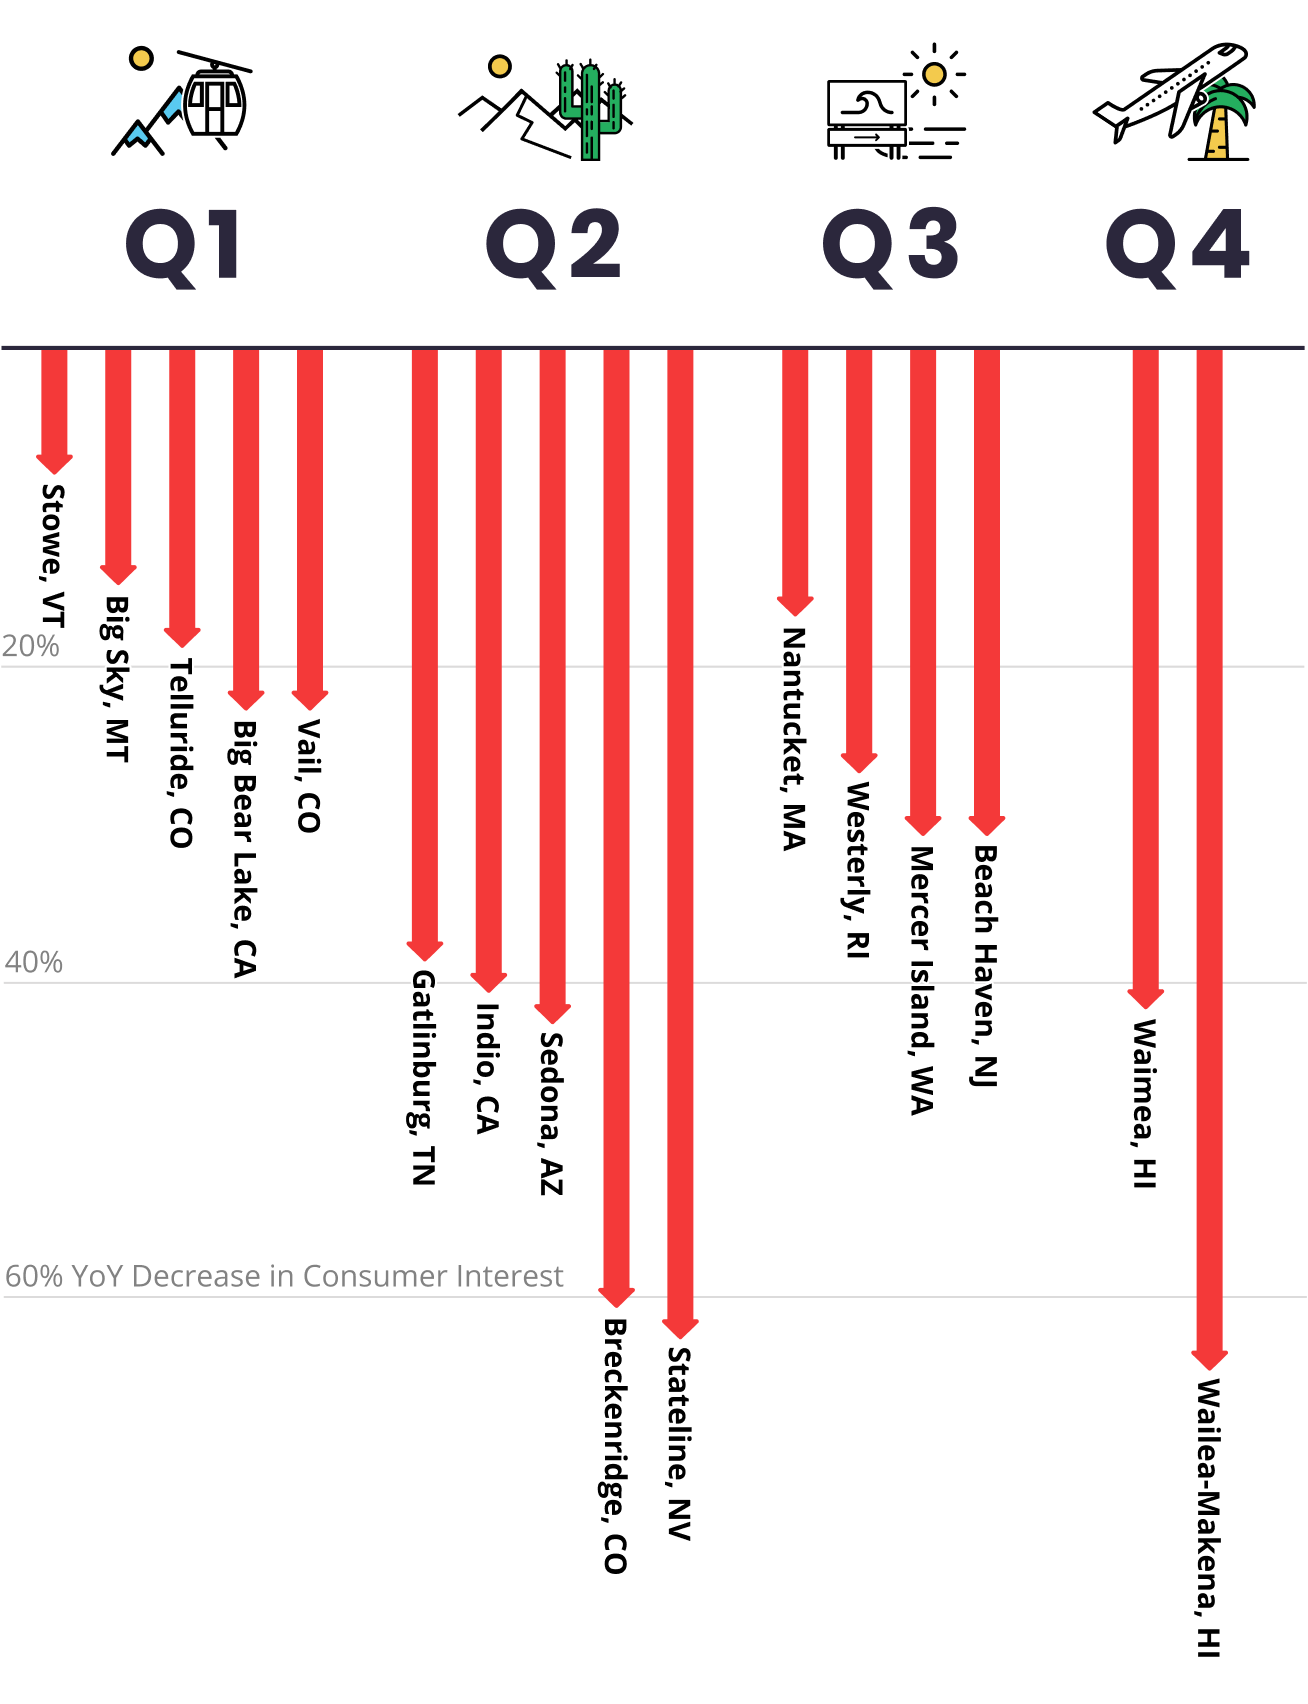
Yelp data indicates that the cities with the largest declines in consumer interest, year-over-year, during Q1 were Vail, CO (23% decrease), Telluride, CO (19% decrease), Stowe, VT (8% decrease), Big Bear Lake, CA (23% decrease), and Big Sky, MT (15% decrease) – all towns primarily known for their ski mountains, which have peak seasons through April. These decreases are especially significant since wide scale response to the pandemic didn’t start until March and the impact of the outbreak was only a factor for one month of the quarter.
Towns hardest hit in Q2 were Gatlinburg, TN (39% decrease), Indio, CA (41% decrease), Sedona, AZ (43% decrease), Hilton Head Island, SC (38% decrease), New Smyrna Beach, FL (31% decrease), Tahoe City, CA (41% decrease), Breckenridge, CO (61% decrease), Stateline, NV (63% decrease), and Surprise, AZ (23% decrease). These popular Spring Break destinations experienced decreased volumes of party goers and spring breakers due to initial efforts to contain the virus. Similarly, the Coachella music festival in Indio, CA was cancelled due to restrictions on large gatherings and ski towns experienced continued declines through Q2, as ski seasons in the West often extend through April.
As temperatures rose in Q3, consumer interest in towns with summertime attractions dipped lower than prior year’s levels. Beachside communities including Beach Haven, NJ (31% decrease), Mercer Island, WA (31% decrease), Stone Harbor, NJ (18% decrease), Friday Harbor, WA (21%), Westerly, RI (27% decrease) and Nantucket, MA (17% decrease) struggled to sustain consumer interest during their peak seasons. In addition, Manitou Spring, CO (21% decrease) – a summertime resort town catering to outdoor adventure sports – experienced a decline in consumer interest. Similarly, Yelp data also revealed consumer interest decreases in small cities with high densities of wedding venues such as Hybla Valley, VA (23% decrease) and Yountville, CA (56% decrease).
In Q4, Yelp data indicated that towns hardest hit were primarily in Hawaii including: Waimea, HI (42% decrease), and Wailea - Makena, HI (65% decrease), during travel restrictions from the continental U.S. Additional declines in consumer interest included cities and towns that were popular for tourists to celebrate Christmas and New Year’s Eve, such as Ypsilanti, MI (33% decrease).
Travel Restrictions Cause Consumer Interest to Plummet in Ski and Beach Towns
Year-over-year decrease in Yelp consumer interest* by quarter for select seasonal towns
Betrothed Couples Are Already Planning Those Delayed 2020 Weddings for 2021
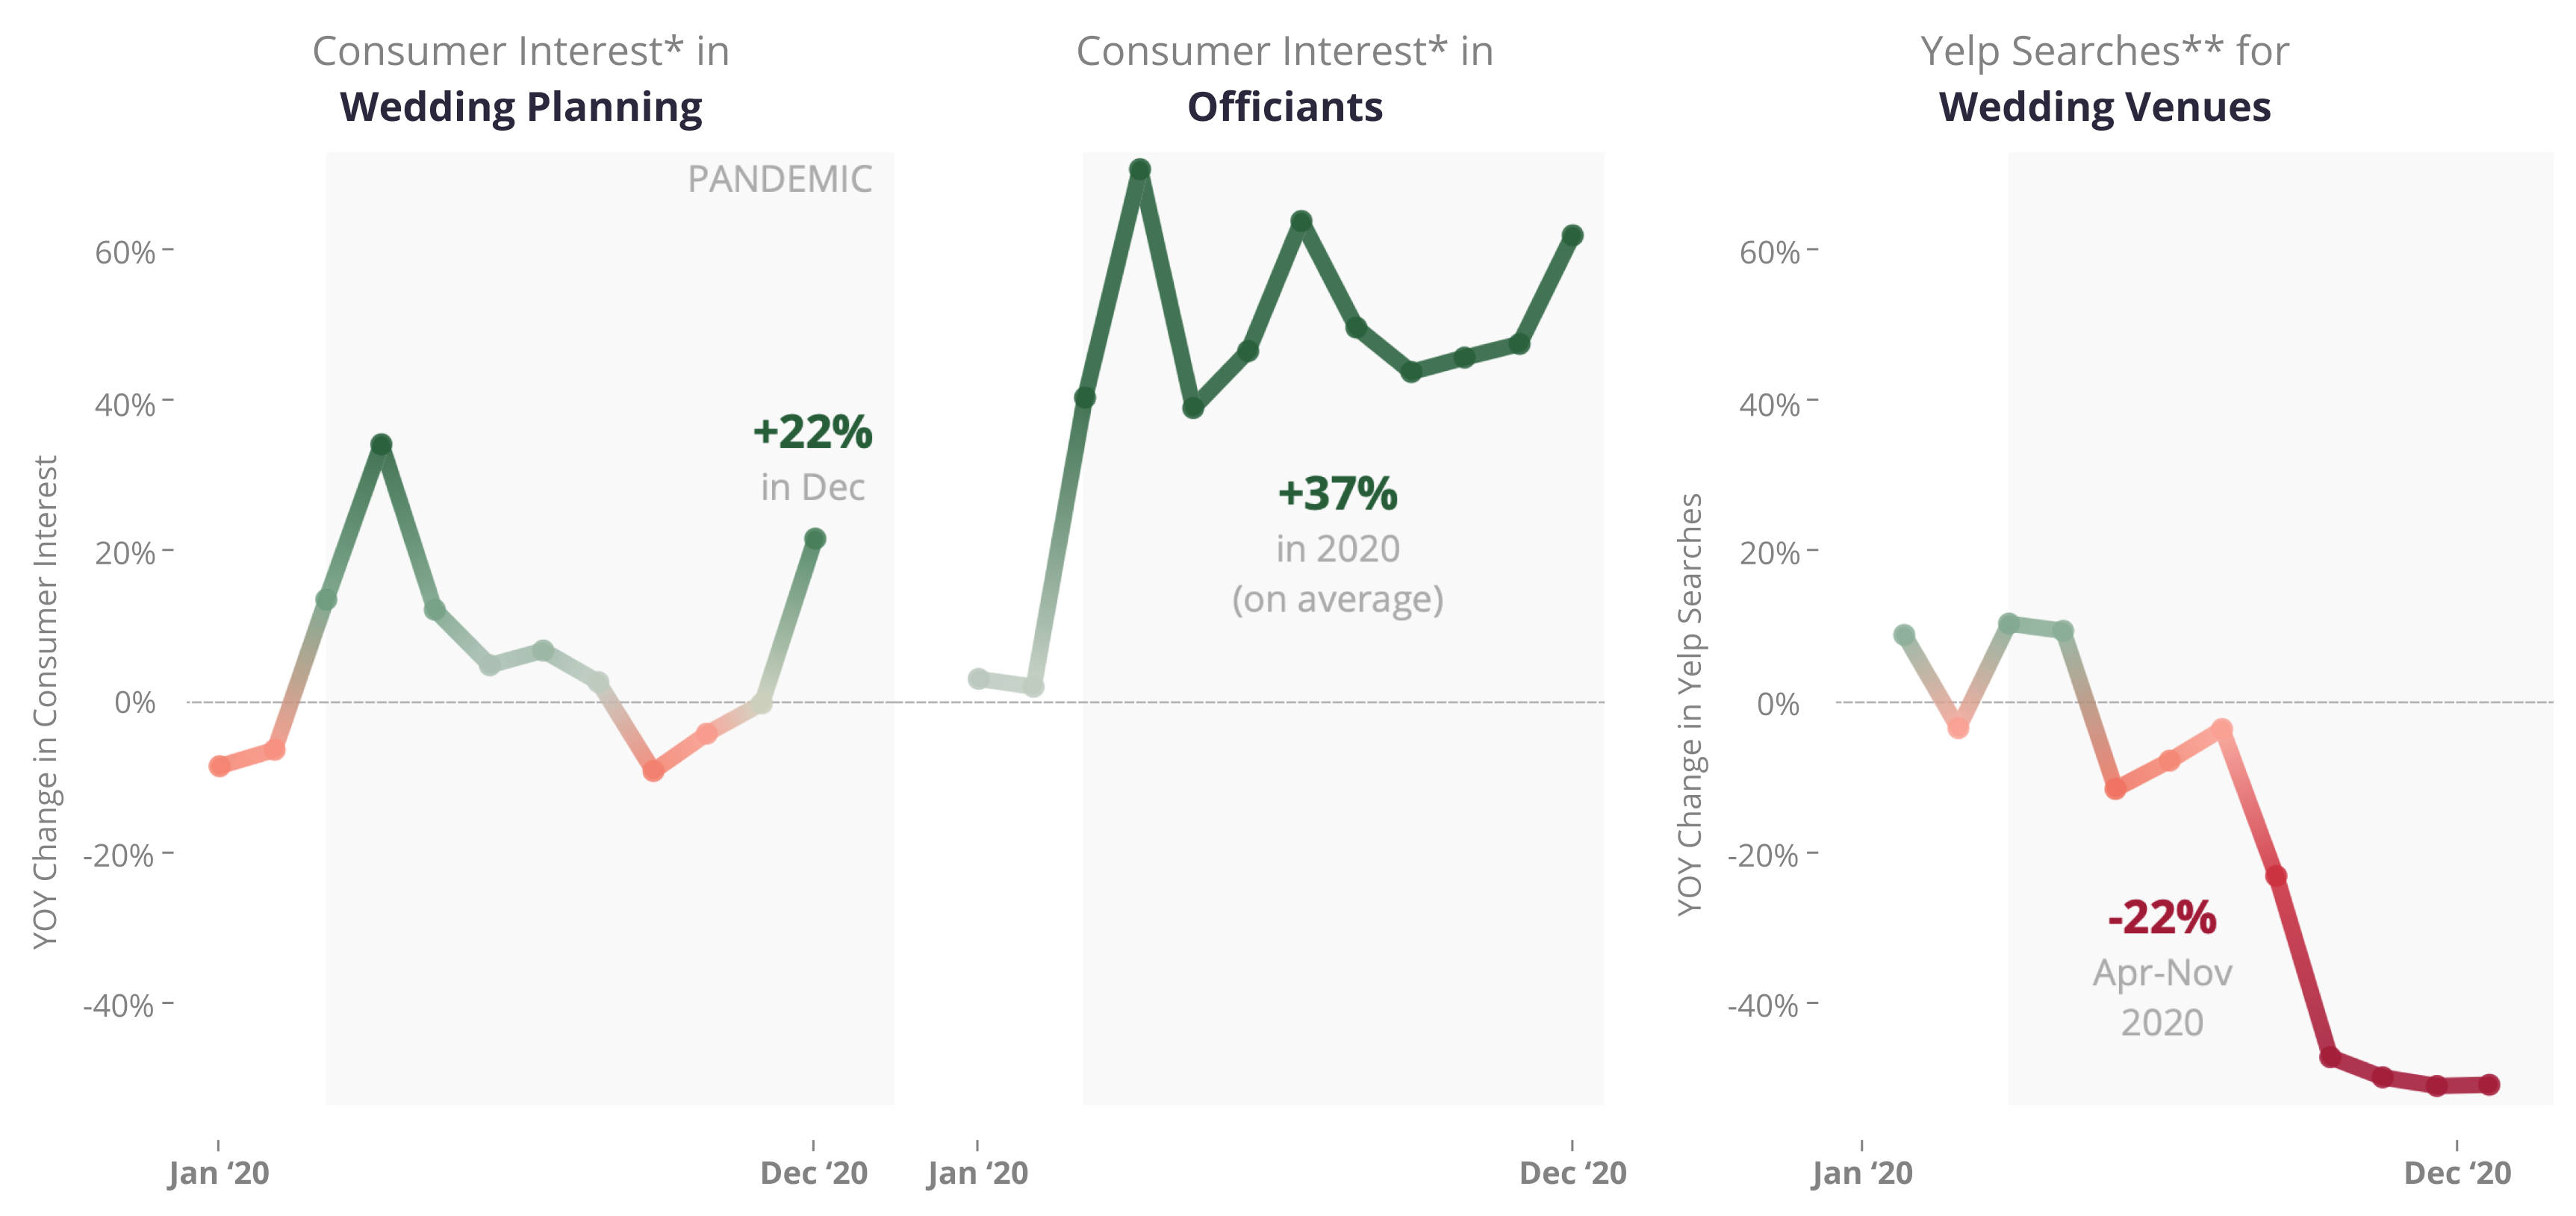
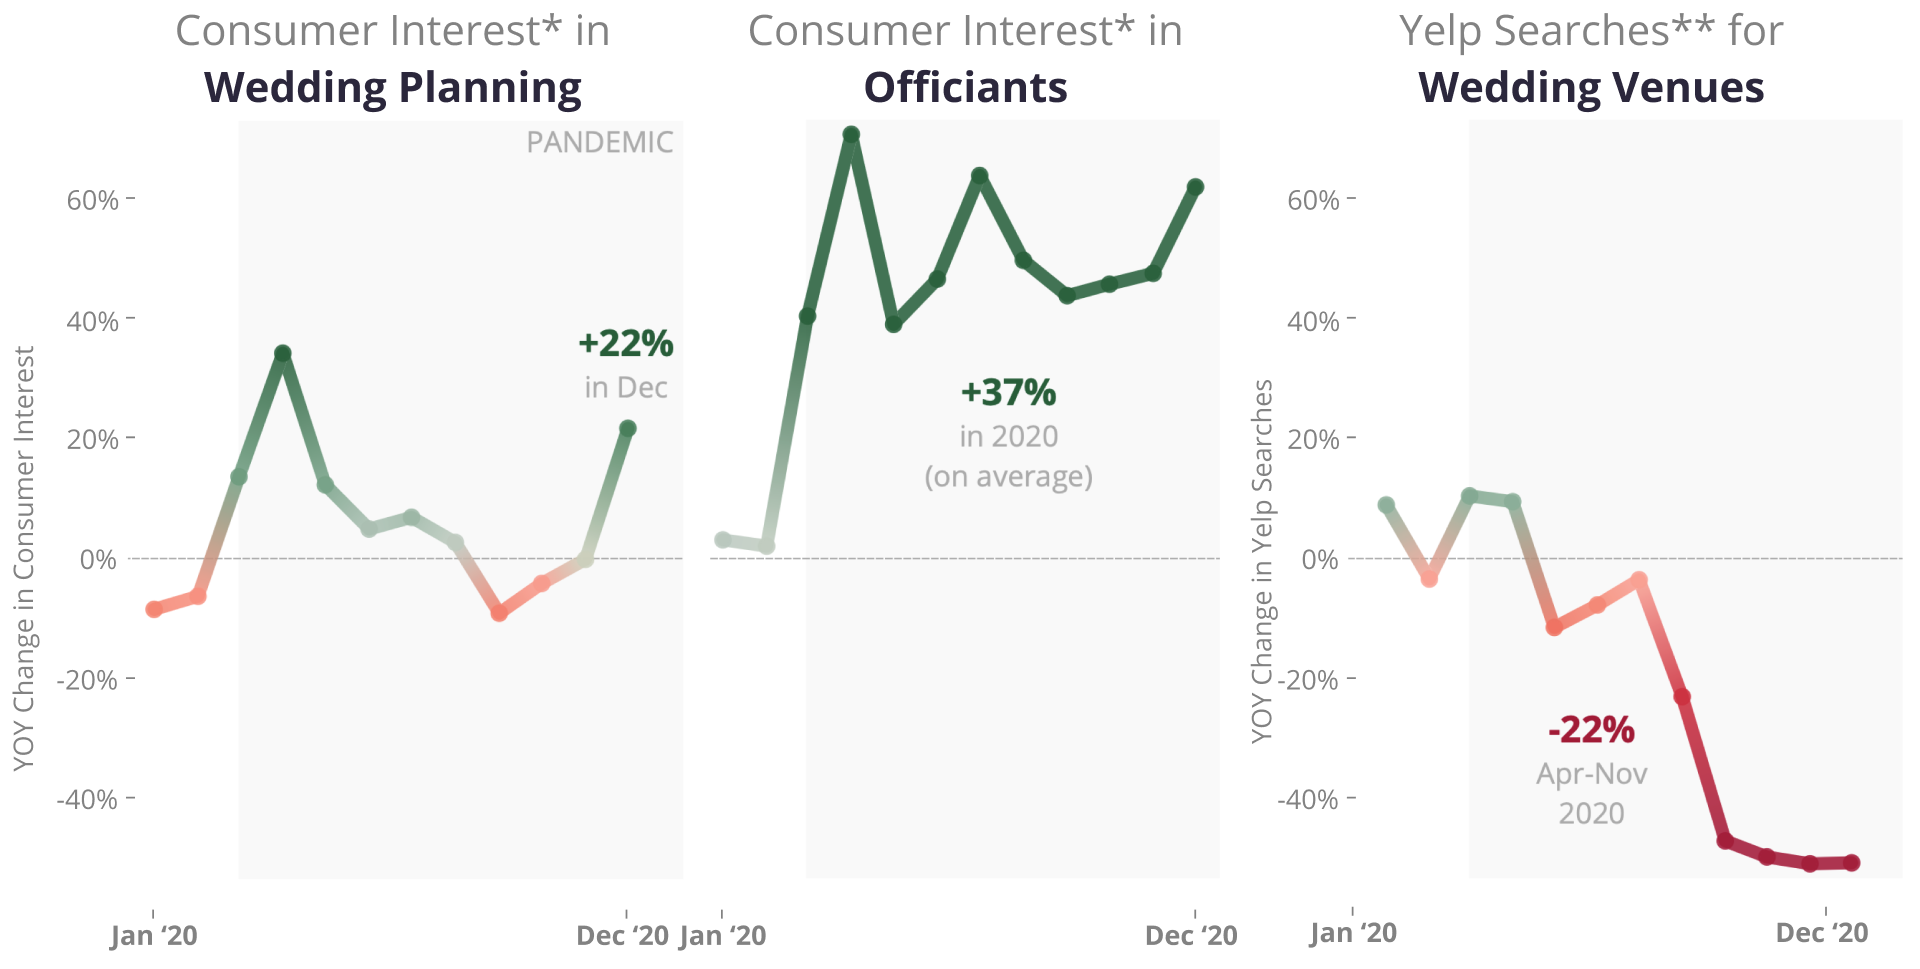
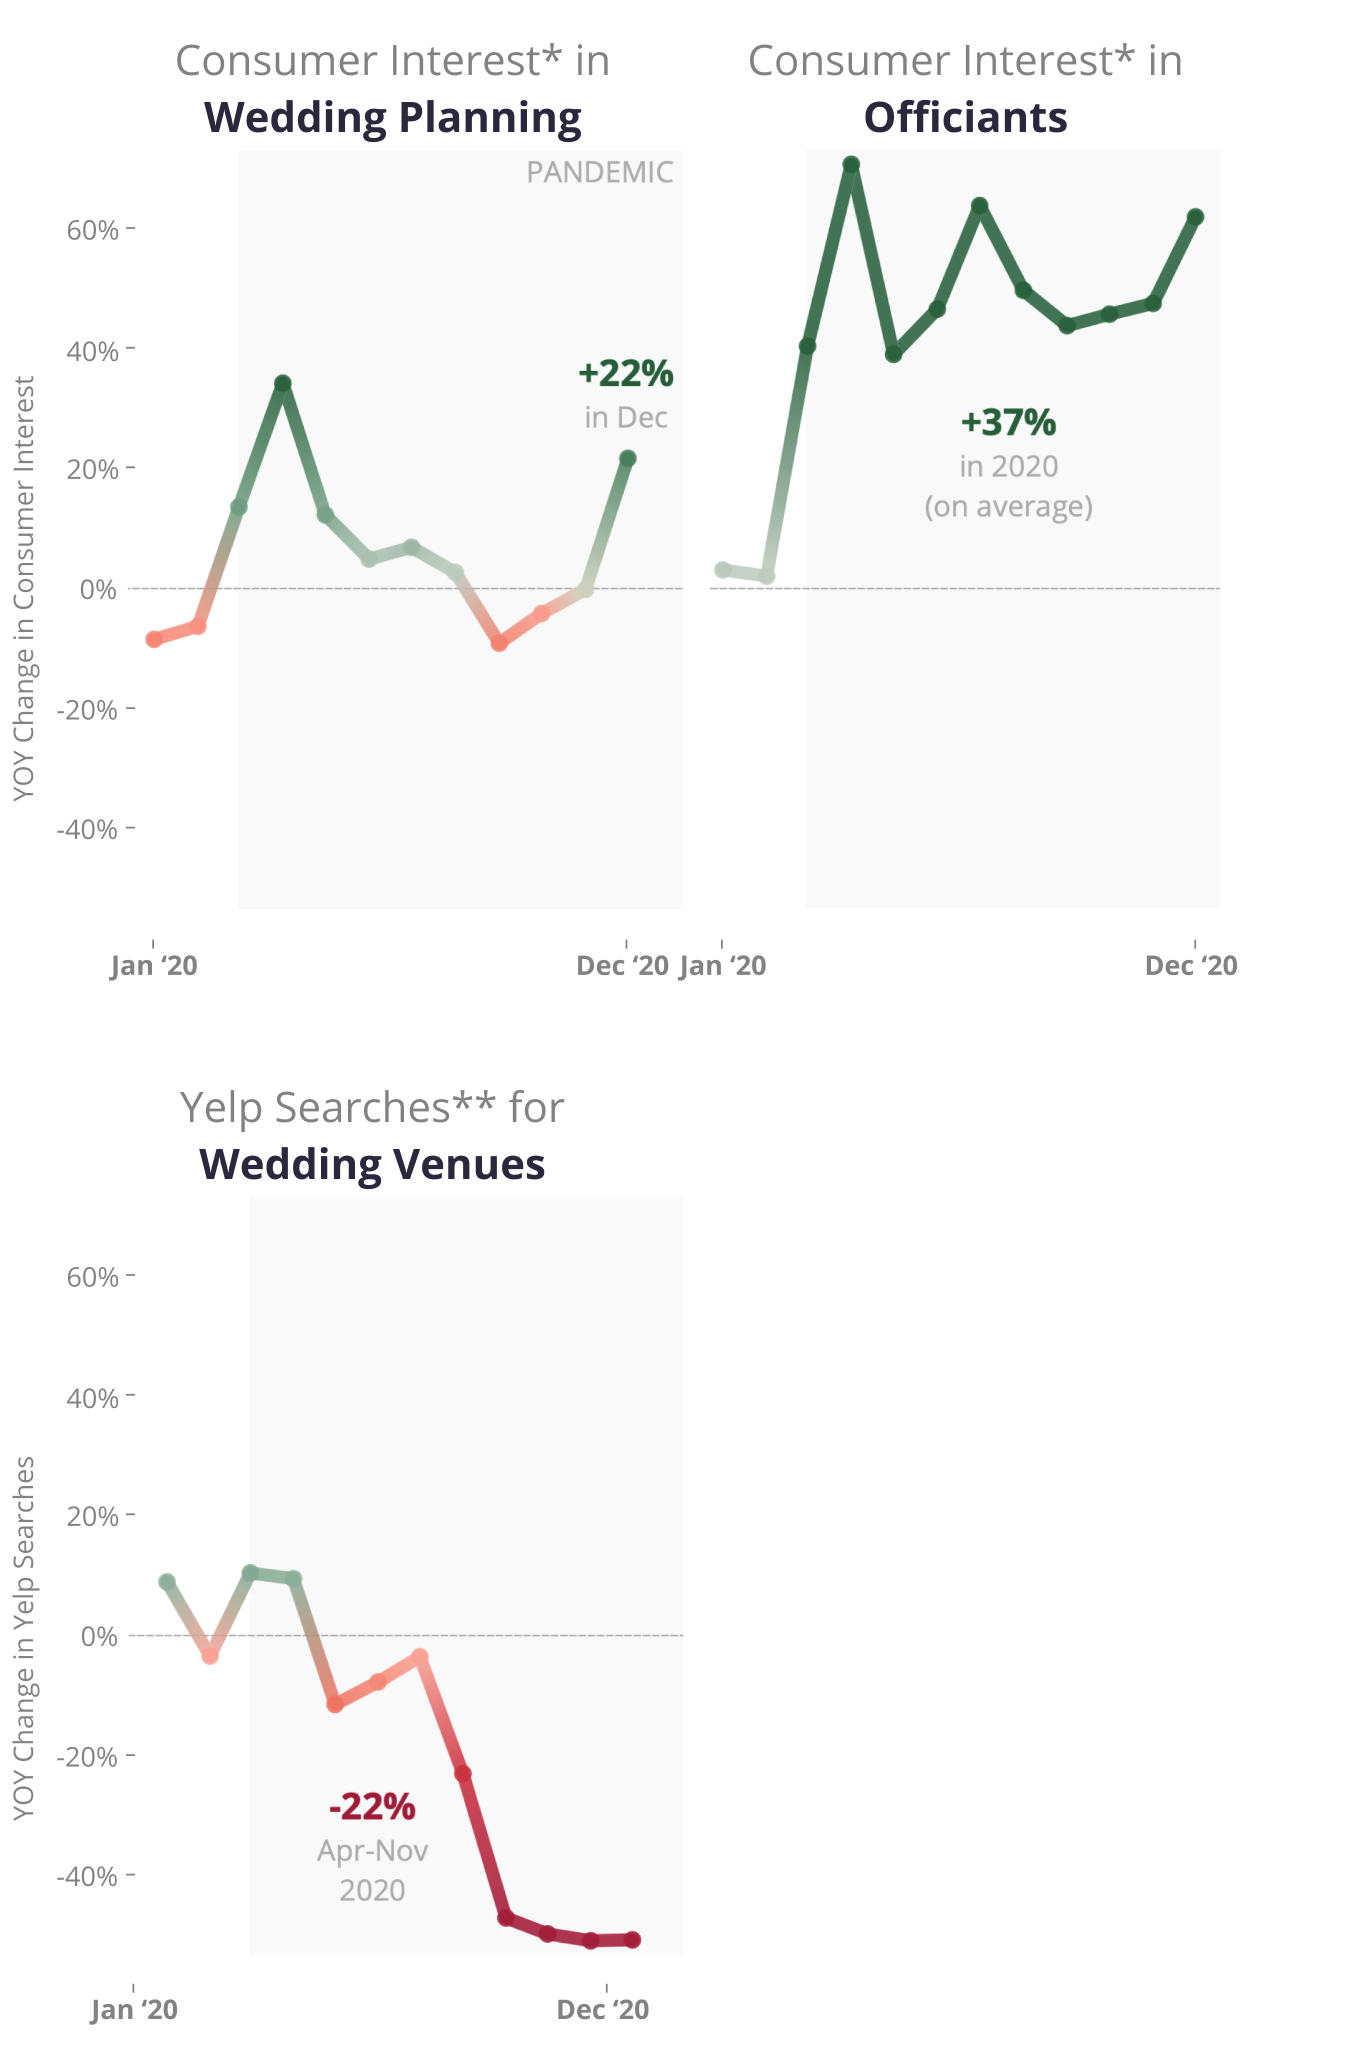
Love can’t be stopped, even by a pandemic. Nationally, Yelp data reveals a decrease in consumer interest in the wedding planning category compared to 2019. Between September and November, consumer interest for wedding planning decreased by an average of 4% compared to the prior year. However, in December, after two COVID-19 vaccines were FDA approved and distribution was initiated, consumer interest in wedding planning increased 22% compared to December 2019.
Throughout 2020, Yelp data shows that many couples continued to marry, just not the way they initially planned. Consumer interest in officiants, a category dominated by both officiants and notary services, was 37% higher in 2020 than in 2019. Conversely, Yelp searches for “wedding venues” in the event services category plummeted 22% April through November 2020 compared to April through November 2019. According to Yelp data, these seemingly conflicting trends are indicative of consumers gravitating towards smaller, intimate wedding ceremonies, rather than large scale wedding ceremonies and receptions.
Since March, many couples faced cancellations of their wedding venue reservations as business owners responded to changing local regulations and fluctuating COVID-19 infection rates. As the pandemic continued through the summer and fall, couples wanting to marry turned to private ceremonies, often without guests or only a few close family members. Local businesses related to the wedding industry, including DJs and wedding dress shops experienced lowered demand overall due to the pandemic. From May to December 2020 the average monthly decrease in consumer interest year-over-year was down 33% (DJs) and 44% (bridal shopping).
The Pandemic Caused Major Shifts in Wedding Categories
Interest in wedding planning and officiants increased, while searches for wedding venues dropped
Every Day Felt Like a Wednesday in May, but Consumers Are Reclaiming Their Weekends
Since mid-March, the COVID-19 pandemic heavily influenced the behaviors and habits of consumers. Yelp data confirms that even the most natural rhythm of the U.S. economy was disrupted by the onset of the pandemic – living for the weekend. In previous years, Yelp data has revealed a weekly pattern of how users interact with the local economy. The weekend – Friday, Saturday, and Sunday – are historically the days of the week where users are most active on the platform.
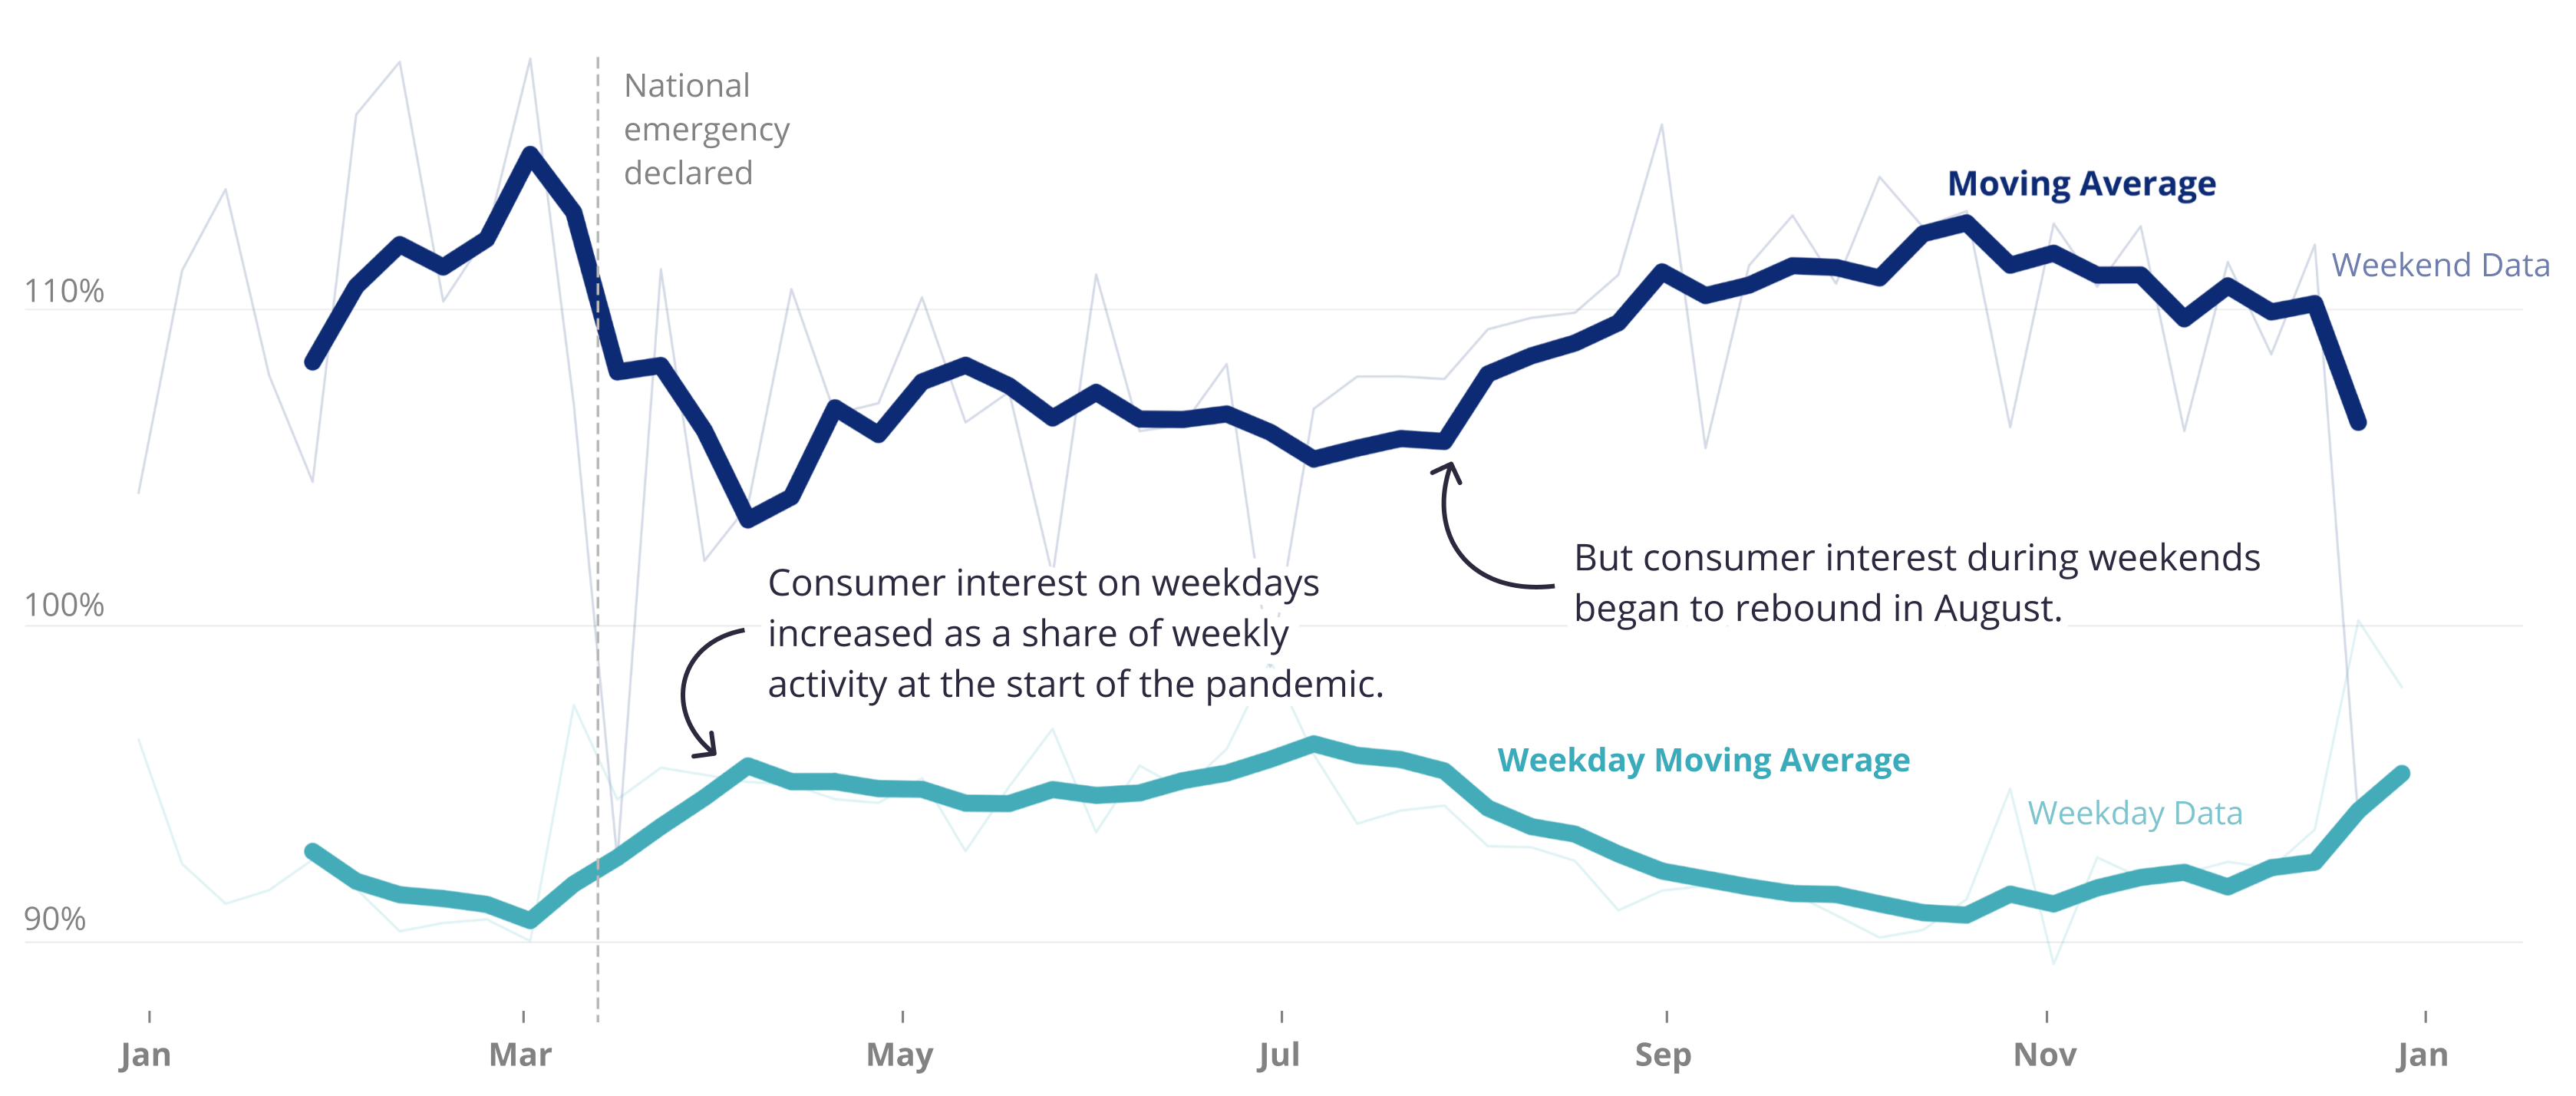
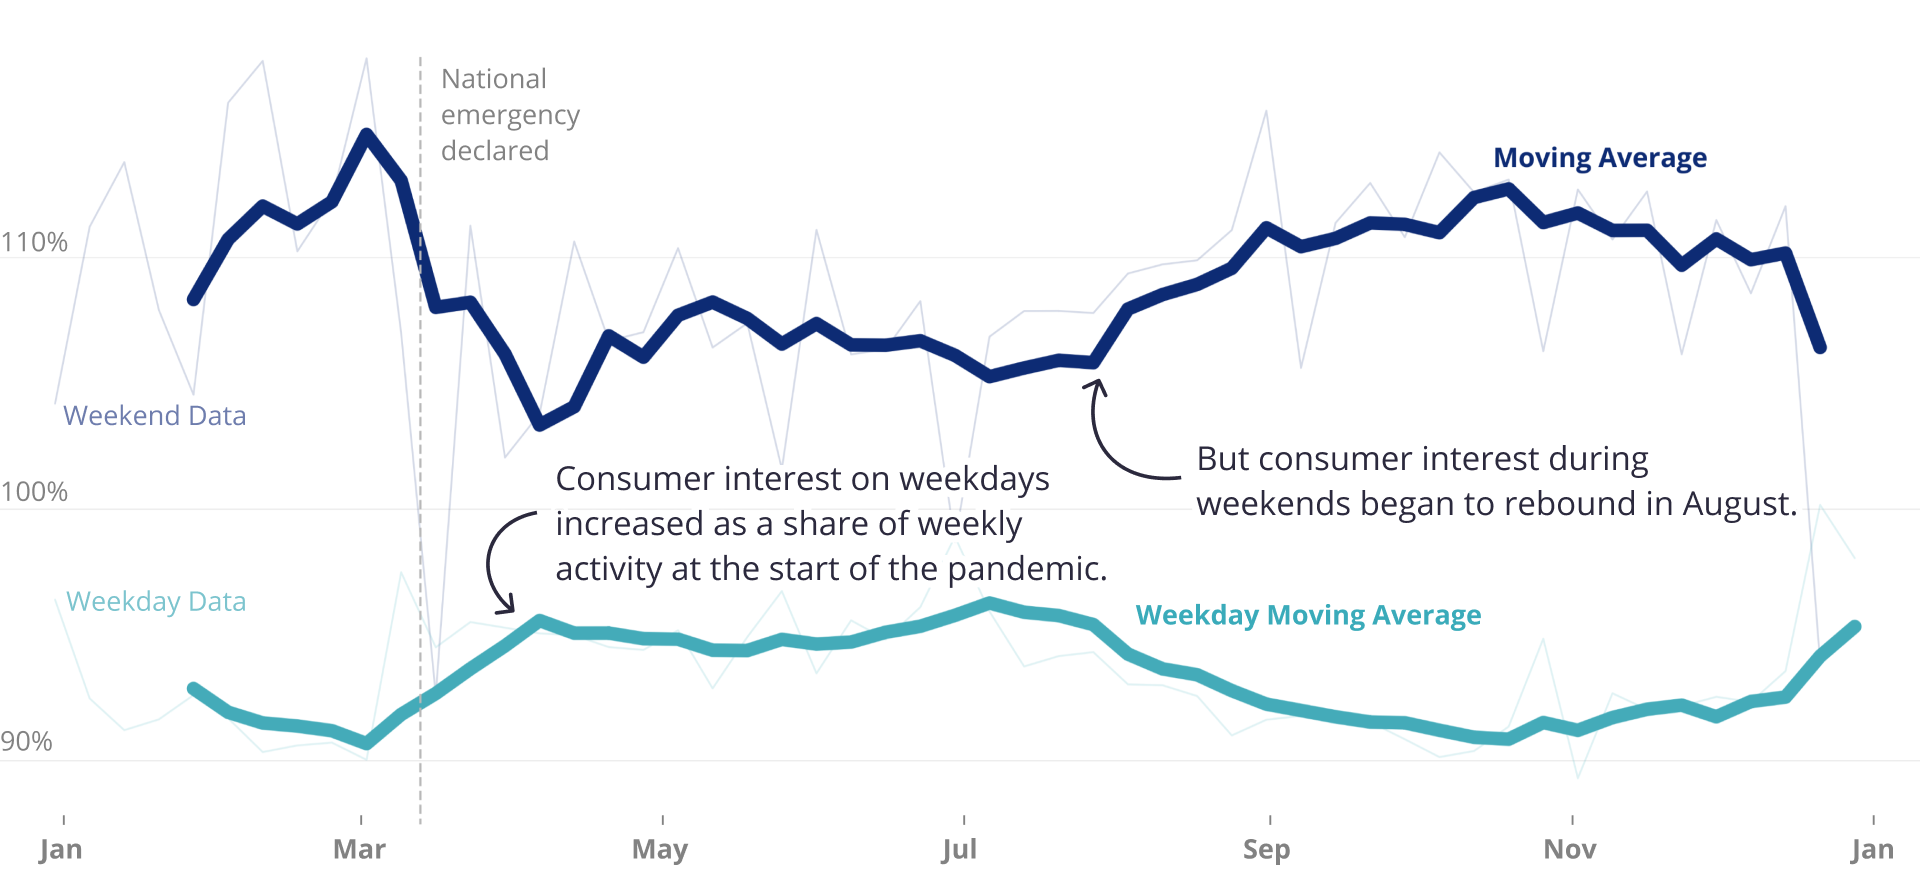
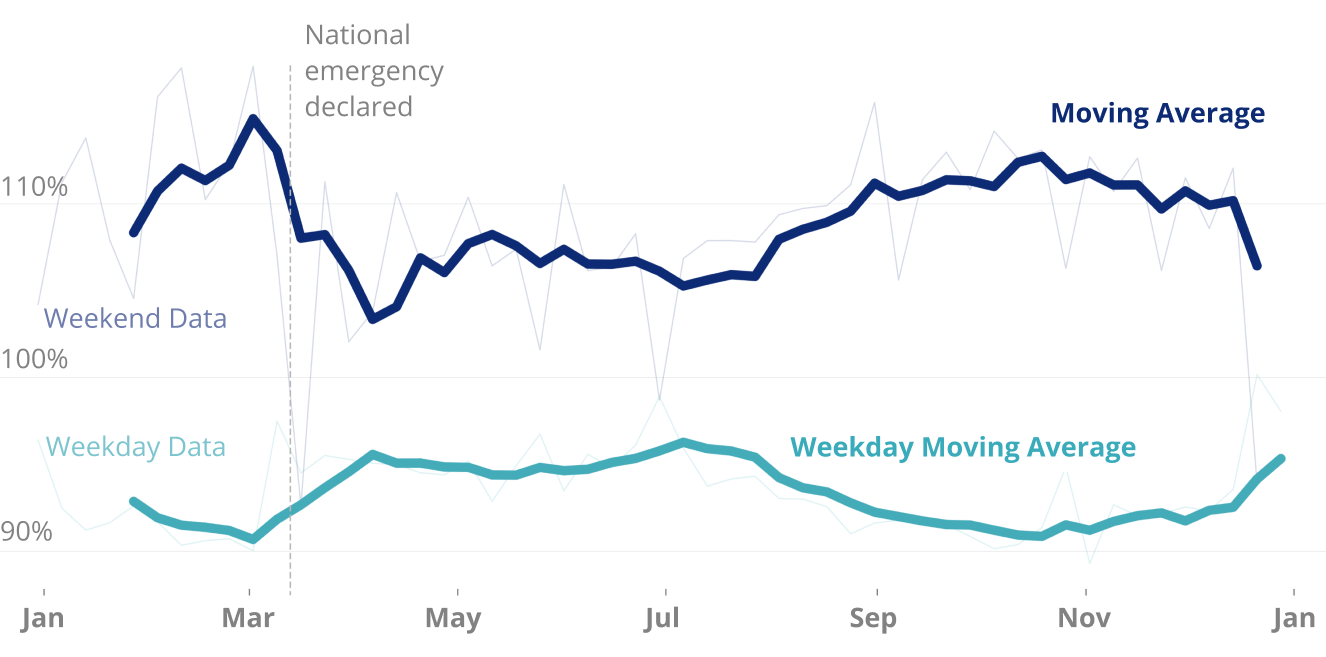
Yelp data shows that weekends became less active and eventful with less variation in consumer interest compared to weekdays' during the uncertainty and confusion surrounding the initial outbreak. Yelp measures this by examining the increase in consumer interest each day relative to the weekly average. March through August, the typical increase in consumer interest relative to the weekly average decreased 40% from 2019, with consumer interest beginning to rebound in August.
Beginning in September and continuing through the end of the year, consumer interest on weekends increased back to pre-pandemic levels, with the weekend bump in consumer interest increasing by 50% relative to the weekly average experienced in March through August. The weekend before Christmas 2020, the average consumer interest action on weekends rose 50% compared to previous years.
Yelp data reveals the categories that experienced the largest changes in consumer interest on weekends, relative to the weekly average throughout the pandemic. Bowling alleys and arcades, museums, kids’ activities, and amusement parks were fixtures in consumers’ weekend activities prior to March and experienced decreases in weekend consumer interest, all down more than 10% March through August. In a display of resilience throughout the year, these categories recovered, as of December 31, with share of consumer interest on weekends up 33%, 29%, 20%, 28%, and 25%, respectively, from their levels early in the pandemic.
The Pandemic Blurred Weekdays and Weekends
Yelp consumer interest in 2020 relative to weekly average
— Jessica Mouras and Carl Bialik contributed to this report
Methodology
Business Openings
Openings are determined by counting new businesses listed on Yelp, which are added by either business owners or Yelp users. Openings are adjusted year-over-year, meaning openings in 2020 are relative to the same period of time in 2019 for the same category and geographic location. This adjustment corrects for both seasonality and the baseline level of Yelp coverage in any given category and geography.
Business Reopenings
On each date, starting with March 1, we count U.S. businesses that were temporarily closed and reopened through December 31. A reopening is of a temporary closure, whether by using Yelp’s temporary closure feature or by editing hours, excluding closures due to holidays. Each reopened business is counted at most once, on the date of its most recent reopening.
To examine the adaptability of local businesses during this year, we compared the number of businesses that reopened only once in 2020 to those that reopened twice, and those that reopened three times or more.
Openings and reopenings are based on when they're indicated on Yelp, as such, the data may lag slightly from the true opening or reopening date due to a delay in reporting from consumers and business owners.
Consumer Interest
We measure consumer interest, in terms of U.S. counts of a few of the many actions people take to connect with businesses on Yelp: viewing business pages or posting photos or reviews.
Consumer interest for each category is based on the 2020 year-over-year change in the category’s share of all consumer actions in its root category.
Additionally, we measured consumer interest for each category based on the monthly year-over-year change in the category’s share of all consumer actions in its root category.
Search Query Text
Search data is used to understand what consumers are searching for throughout the year. To gather this data, we looked at all search query text entries for the event planning category in 2019 and 2020. To compare the change in volume of a specific search query, we evaluated the number of times per million searches the query was entered. We evaluated this for each week of 2020 and 2019 to determine the year-over-year relative change in search share over time.
Consumer Action Day of Week
Yelp’s consumer action measure counts page views, reviews, and photos.
By totalling the number of consumer actions for each day of the year and comparing the total to the week’s average, you arrive at the day’s share of the weekly total. Specifically, we evaluated each day’s actions relative to the weekly average to compare the changes in consumer interest on weekdays versus weekends (Friday through Sunday) throughout the year. We additionally measured, by category, the weekend’s change in weekly action share during three periods of 2020: January 1 through March 7, March 8 through August 22, and August 23 through December 31.
Downloadable static graphics can be found here.
See Yelp's previous Coronavirus Economic Impact Reports at our Data Science Medium, Locally Optimal.


