One Year into the Pandemic, Yelp Data Reveals Impact on Local Economies
Wednesday, March 10th
For the COVID-19 Anniversary report, we’re using a new methodology that tracks several indicators on a daily basis. For more on the methodology for this report, click here.
March 11 marks the one year anniversary of a major turning point in the lives of people in America – it’s the date the World Health Organization declared the COVID-19 outbreak a global pandemic. In the days and weeks that followed, cities and states mandated business closures and implemented stay-at-home orders in an effort to contain the spread. Yelp’s data scientists looked into notable trends during the first year of the pandemic, uncovering the resilience of local businesses with nearly half a million new business openings, new consumer behaviors in a socially distanced world, and changes to daily routines across fitness and beauty, among others.
Nearly Half a Million New Businesses Opened
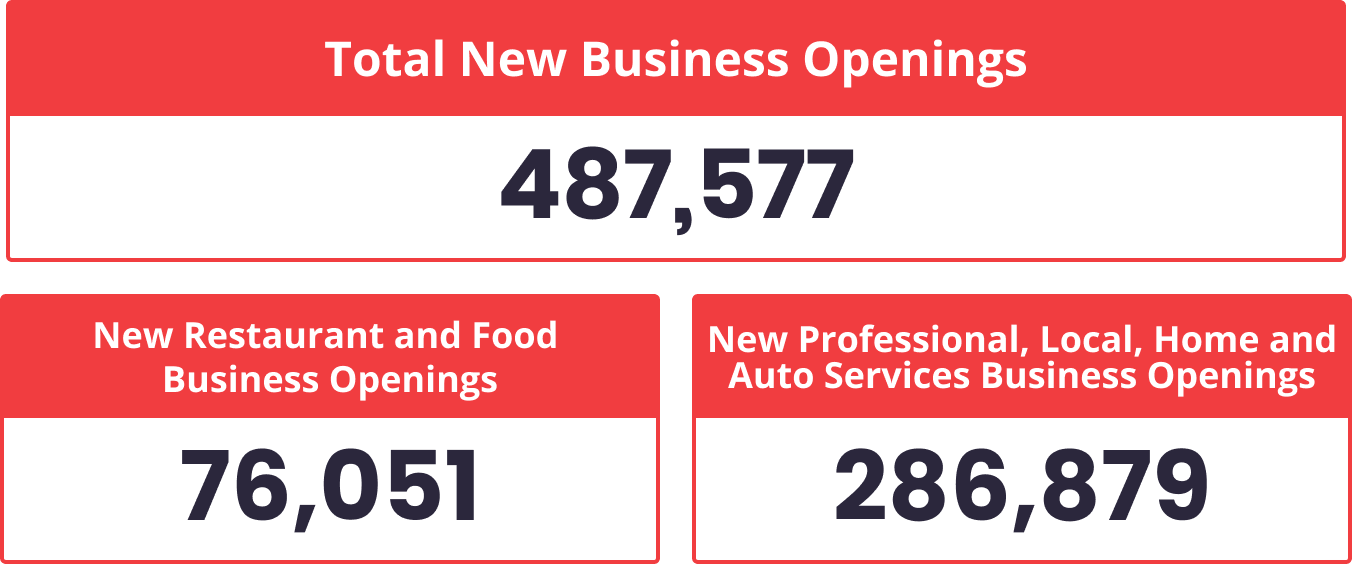
Though small businesses faced an incredibly challenging year, Yelp data indicates there were nearly half a million new business openings (487,577 total) in the U.S. during the first year of the pandemic, March 11, 2020 through March 1, 2021 – down by only 14% year-over-year (YoY). Of the newly opened businesses, 76,051 were restaurant and food businesses, down by 18% YoY. With people spending more time at home and in their cars (as many people opted for road trips instead of air travel) 286,879 new professional, local, home and auto businesses opened – on par with the year prior, down by only 1% YoY.
In the restaurant and food categories, food delivery services (up 128%), chicken shops (up 23%), desserts (up 17%) and food trucks (up 12%) saw the largest increases in new business openings, compared to the prior year. Notaries (up 52%), landscaping (up 42%), auto detailing (up 37%) and contractors (up 5%) saw the largest increases in the professional, local, home and auto services categories.


Businesses Adapted and Many Reopened
As local regulations continued to change throughout the last year, businesses had to adapt – many by temporarily closing and reopening again. Between March 11, 2020 and March 1, 2021, 260,852 businesses reopened in the U.S. Of all reopenings, 85,446 were restaurant and food businesses and 36,199 were professional, local, home, and auto services businesses.
People Explored New Outdoor Activities and Sought Answers from Psychic Mediums
Consumer interest in drive-in movies (up 329%) and outdoor movies (up 99%) spiked as Americans looked for socially distanced activities, along with skate parks (up 75%), disc golf (up 73%), racetracks (up 71%) and horseback riding (up 41%). The average review mentions per million for “glamping” increased 53% (see Yelp’s top glamping destinations).
Consumers Picked Up New Outdoor Hobbies During the Pandemic
Americans also found themselves seeking answers from professionals like psychic mediums and psychics (up 74%), mystics (up 71%), psychic astrologists (up 69%) and astrologers (up 63%).
Consumers Sought Answers During the Pandemic
People Adjusted to Spending More Time at Home
As our lives and routines changed drastically, consumer interest for fitness equipment during the first year of the pandemic increased 175% and searches for restaurant takeout increased by 185%. However, contrary to what one might expect with shutdowns and stay-at-home orders across the country, consumer interest in waxing only decreased 6% during the first year of the pandemic, indicating that many were eager to get back to their waxing appointments once those services resumed.
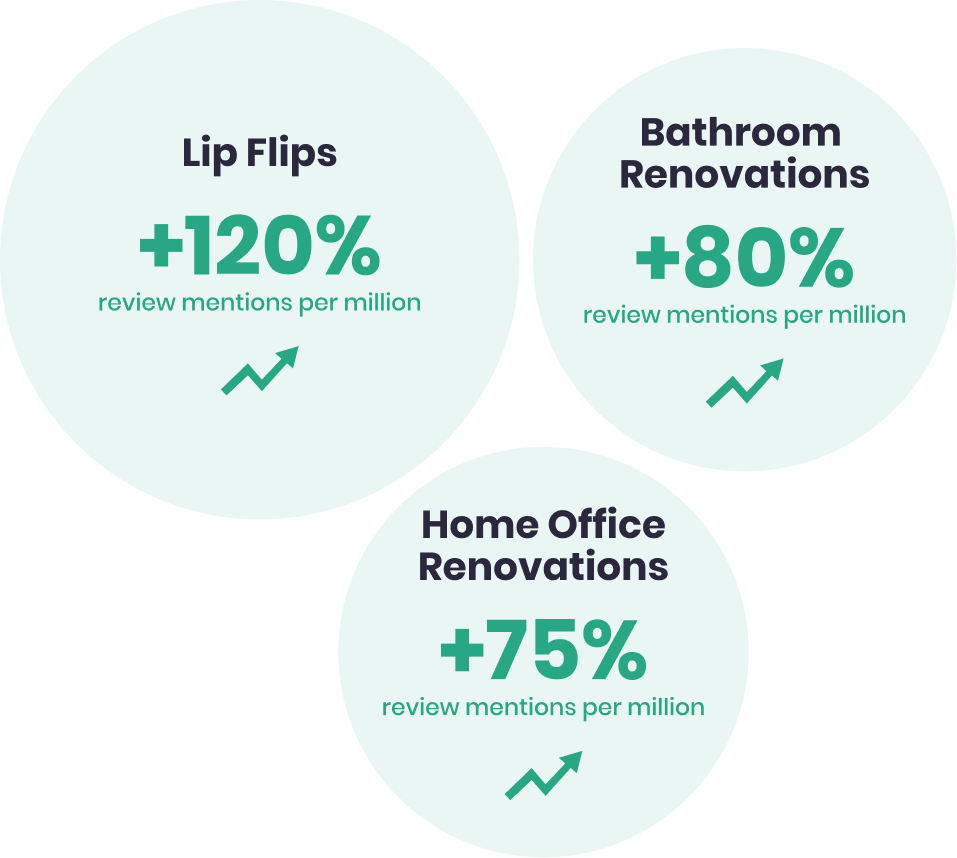
Our data showed that the “Zoom Face” phenomenon may not be overblown: The average review mentions per million for the cosmetic procedure known as ‘lip flips’ increased 120% during the same timeframe.
With more time than ever in our homes, average review mentions per million for home offices and bathroom remodels and renovations increased 75% and 80%, respectively.
Zoom Calls and Working From Home Have Shifted Consumers’ Interests


To learn about other trends Yelp data revealed during the course of the pandemic, read Yelp’s Home Trend Forecast Report and 2021 Trend Forecast Report.
— Jessica Mouras and Carl Bialik contributed to this report.
If you'd like additional detail on how the economy is shifting, please contact us at press@yelp.com or join our mailing list to receive an email when new reports are released.
Interested in learning how Yelp data can assist you in developing market insights for your business? Yelp Knowledge can help, learn more here.
Methodology
Business Openings
Openings are determined by counting new businesses listed on Yelp, which are added by either business owners or Yelp users. Openings are adjusted year-over-year, meaning openings in March 11, 2020 through March 1, 2021 are relative to the same period of time in 2019 and 2020 for the same category and geographic location. This adjustment corrects for both seasonality and the baseline level of Yelp coverage in any given category and geography.
Reopenings
On each date, starting with March 11, 2020, we count U.S. businesses that were temporarily closed and reopened through March 1, 2021. A reopening is of a temporary closure, whether by using Yelp’s temporary closure feature or by editing hours, excluding closures due to holidays. Each reopened business is counted at most once, on the date of its most recent reopening.
Consumer Interest
We measure consumer interest, in terms of U.S. counts of a few of the many actions people take to connect with businesses on Yelp: viewing business pages or posting photos or reviews.
Consumer interest for each category is based on March 11, 2020 through March 1, 2021 year-over-year change in the category’s share of all consumer actions in its root category.
Searches
Search data is used to understand what consumers are searching for throughout the year. To gather this data, we looked at all search query text entries for the restaurant category. To compare the change in volume of a specific search query, we evaluated the number of times per million searches the query was entered. We evaluated this for each week of 2021, 2020, and 2019 to determine the year-over-year relative change in search share over time.
Reviews
Review data counts review mentions of specific input phrases between time periods and can be, optionally filtered by category and geography. To compare the change in volume of a specific review text phrase, we evaluated the number of times per million the phrase appeared in reviews. We evaluated this for each month of 2021 (through March 1), 2020, and 2019 to determine the year-over-year relative change in review mentions over time.
Downloadable static graphics can be found here.
See Yelp's previous Coronavirus Economic Impact Reports at our Data Science Medium, Locally Optimal.


