Q1 2021
Q1 Yelp Economic Average Shows Road to Recovery as Local Economies Reopen
For the Q1 2021 Yelp Economic Average report, we’re using a new methodology that tracks several indicators on a daily basis. For more on the methodology for this report, click here.
The start of the new year brought many positive changes to local economies – a downward trend of nationwide COVID-19 cases, more than 200 million vaccinations administered and many local businesses reopening with larger capacity and indoor operations. In January, our Yelp Economic Average 2020 annual report showed early signs of recovery, even during the largest wave of COVID-19 cases, and demonstrated how consumers had adjusted their vacations, weddings and weekend plans to meet their COVID-safe lifestyle.
First quarter Yelp data shows strong signals of local economic recovery with more than half a million new businesses opening in the last year. New business openings in Q1 reached their highest levels in the last 12 months, with restaurant and food business openings, as well as home, professional, local and auto service openings above Q1 2020 levels. Business reopenings are also rising across the country with reopenings in each month of the first quarter the highest they have been since August 2020. Yelp data also shows how consumers are adapting in communities that have reopened, putting down roots in new places and beginning to return to some pre-pandemic activities.
New Business Openings in Q1 Hit Highest Level over the Last Year, Restaurant, Food, Home, Local, Professional and Auto Services Business Openings Above Q1 2020 Levels
Though local businesses are still experiencing continued challenges and capacity restrictions, Yelp data shows that more new businesses opened in the U.S. during the first quarter of 2021 than at any other period over the last 12 months. With 146,486 total business openings in Q1 2021, the level of new openings is comparable to years prior, down by only 2% year-over-year (YoY) and up by 4% from Q1 2019.
During the first quarter, restaurant and food business openings (18,217) were up by 5% from Q1 2020 and down by only 4% from Q1 2019. Professional, local, home and auto sectors also saw a significant number of new business openings (79,332), up by 5% from Q1 2020 and up by 23% from Q1 2019. Of those, home services had the highest number of new openings in Q1 (48,592 up 4%), followed by local services (16,602 up 16%), professional services (14,134 up 2%) and auto services (9,790 up 10%).
New Business Openings Spike in Q1 Across Categories
Business openings by month, Apr 2020 – Mar 2021
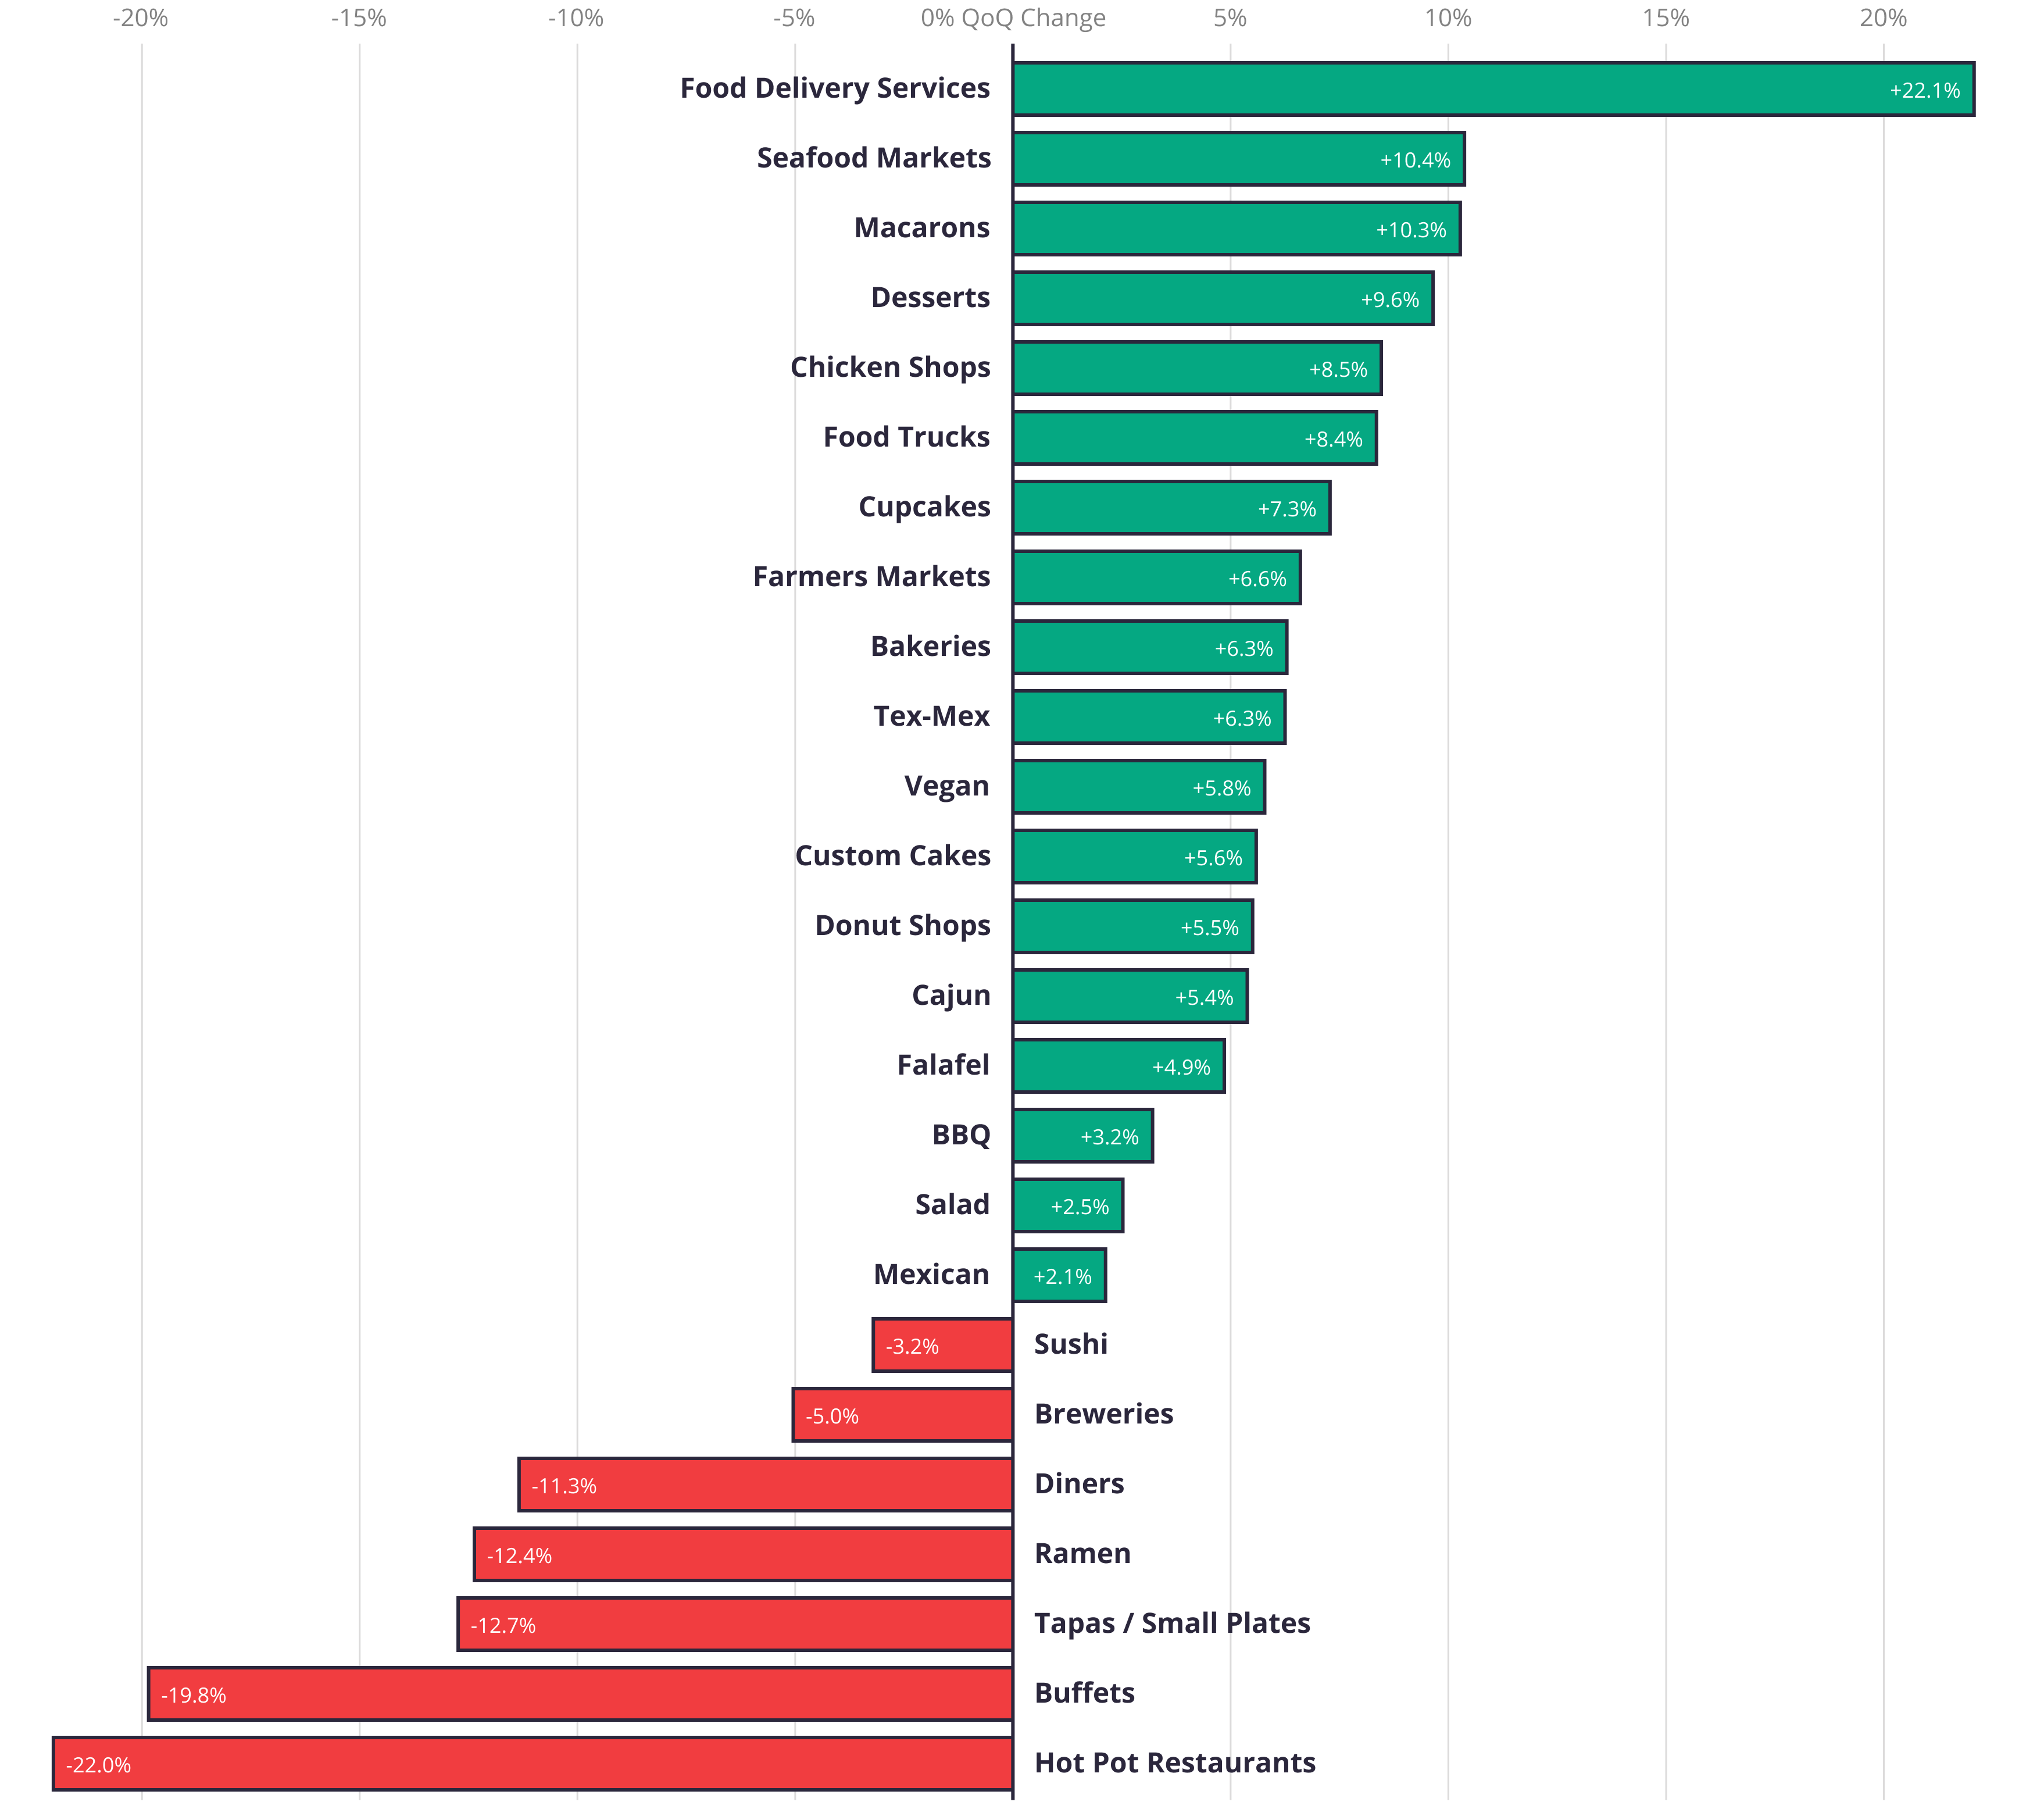
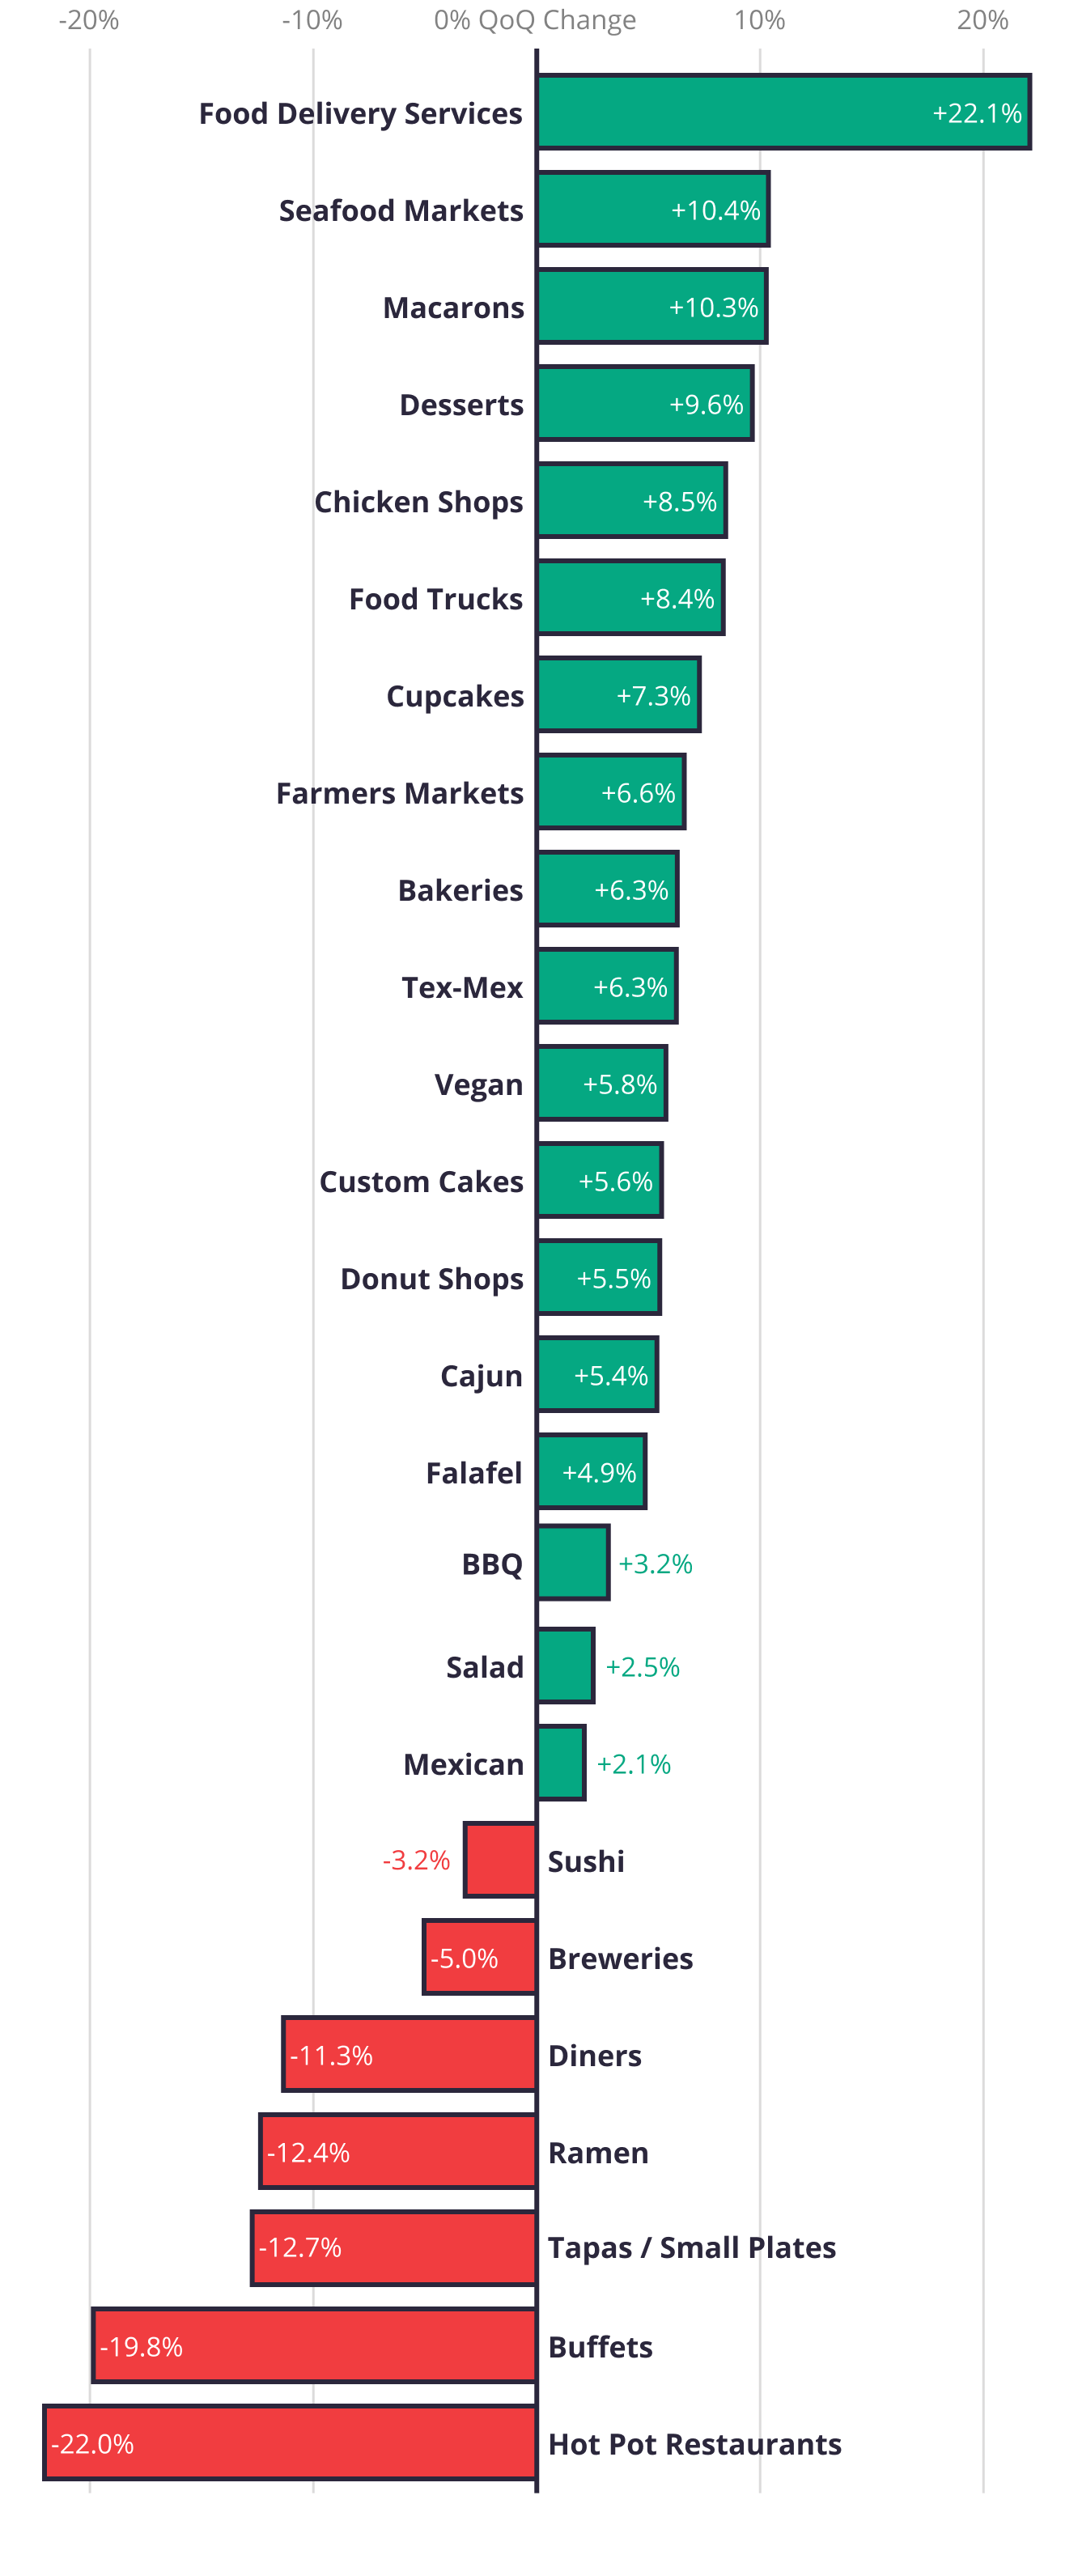
Comparing openings from Q1 2021 to Q4 2020, Yelp data shows that restaurant and food businesses that cater to takeout, outdoor dining or other COVID-19 safe measures continue to grow in popularity, including food delivery services (2,732 openings in Q1, up by 22% quarter-over-quarter (QoQ)), seafood markets (298 openings, up 10%), chicken shops (1,000 openings, up 8%), food trucks (6,060 openings, up 8%) and farmers markets (549 openings, up 7%). Bakeries and dessert shops are also still on the rise, as people continue to turn their baking hobbies into new ventures during the pandemic – comparing Q1 2021 to Q4 2020, desserts (5,682 openings, up 10%), cupcakes (1,694 openings, up 7%), macarons (161 openings, up 10%), bakeries (3,379 openings, up 6%) custom cakes (1,682 openings, up 6%) and donut shops (939 openings, up 6%) all saw an increase in openings. As the pandemic continues to affect some dining experiences, especially ones best suited for groups, some restaurant and food businesses are seeing a decline in new openings relative to the previous quarter, including hot pot restaurants (92 openings in Q1 2021, down 22%), buffets (105 openings, down 20%), tapas (274 openings, down 13%) and ramen (411 openings, down 12%).
The Pandemic Influenced Restaurant and Food Openings in Q1
Change in business openings on Yelp for select categories, Q1 2021 vs. Q4 2020

Yelp data reveals insight into the recent home buying frenzy, as many businesses related to moving preparations opened within the home and local services sectors in Q1, such as truck rentals (378 openings, up 26% QoQ), dumpster rentals (857 openings, up 21%), junk removal (6,181 openings, up 19%), home appliance repair (1,767 openings, up 8%), carpet installation (443 openings, up 15%) and HVAC services (5,224 openings, up 5%) all saw large increases from the prior quarter. Meanwhile, business openings for services outside the home decreased, relative to Q4, including childcare (2,383 openings, down 14%) and shared office spaces (584 openings, down 8%).
More Than Half a Million New Businesses Open
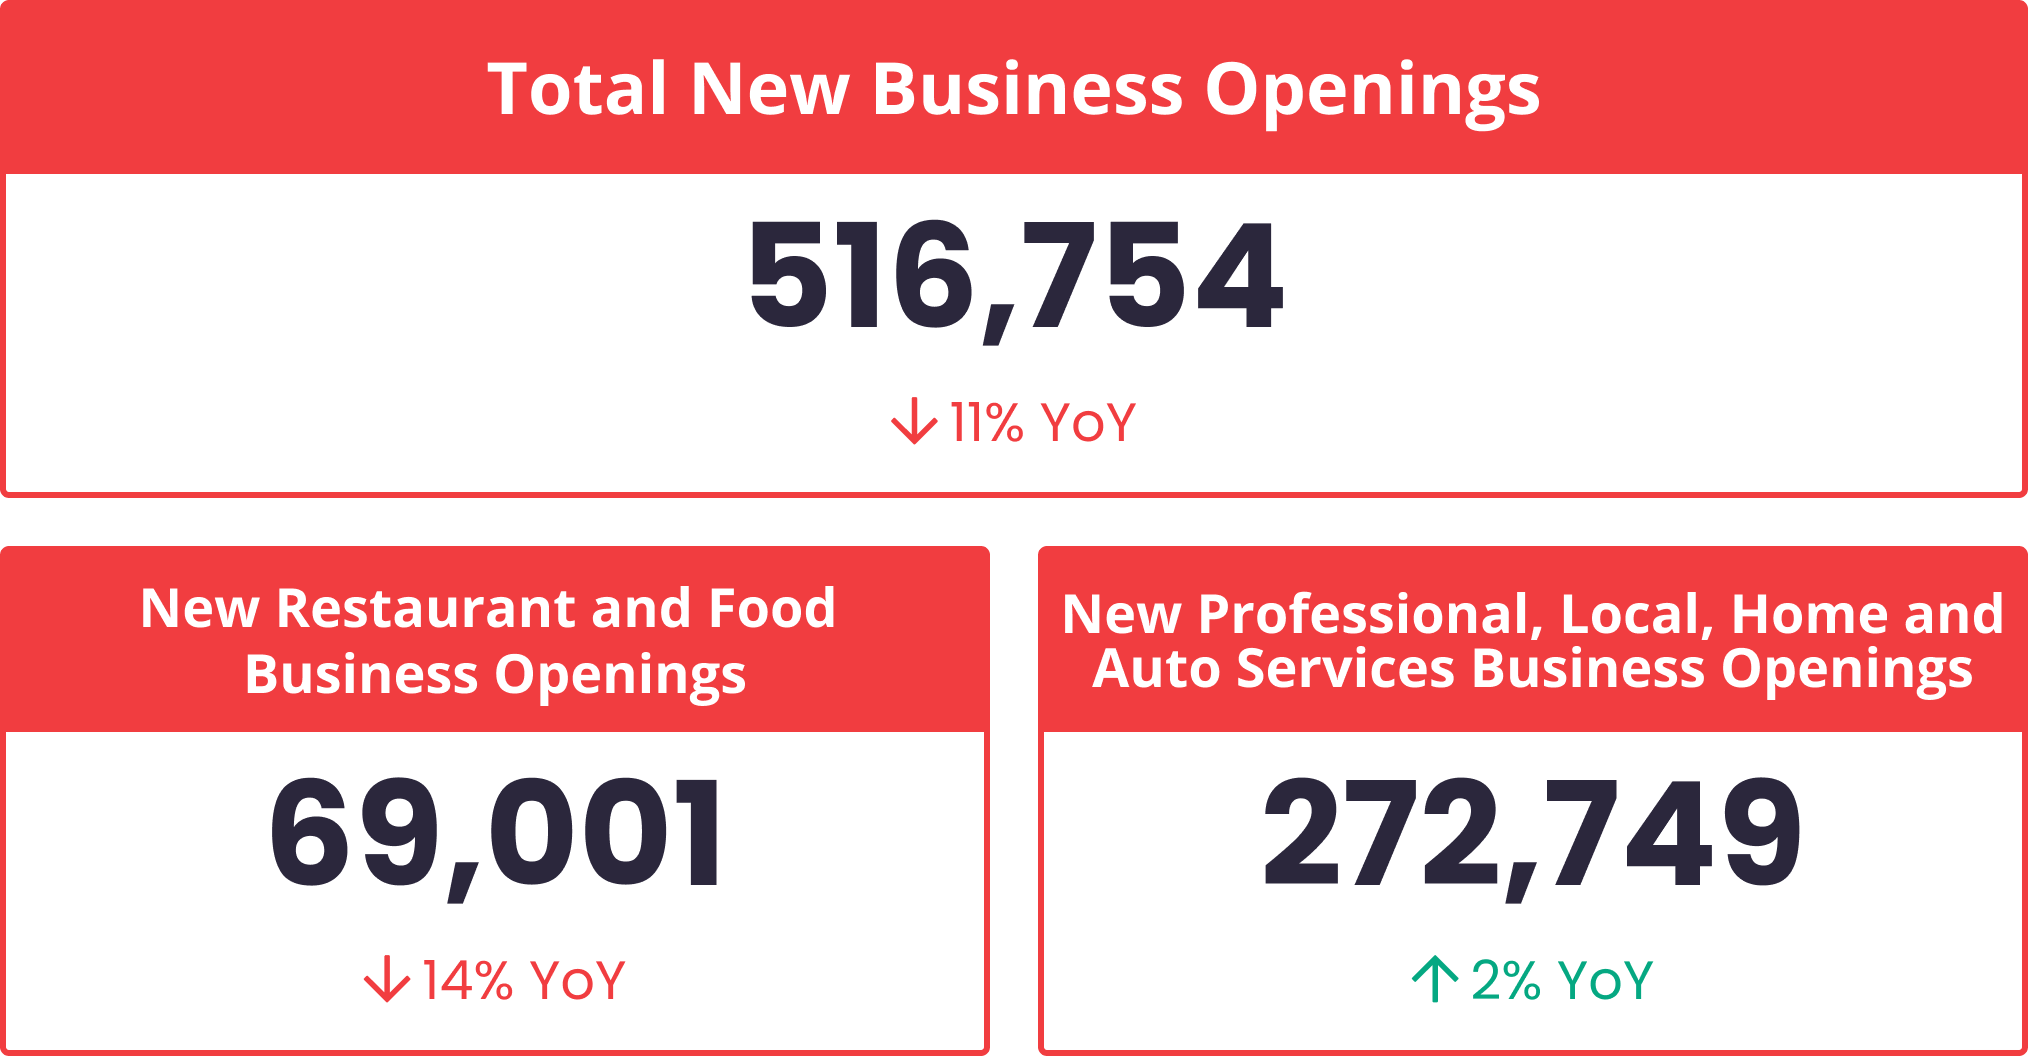
Over the course of the last year, Yelp data indicates there were 516,754 new business openings in the U.S. (April 1, 2020 through March 31, 2021), down by only 11% YoY. Of the newly opened businesses, 69,001 were restaurant and food businesses, down by 14% YoY.
The entrepreneurial spirit is evident within home and local services. Many entrepreneurs leveraged skills to pivot into business ownership during the difficult last year as a result of job loss, underemployment, or unique increases in demand for services. In professional, local, home and auto categories, 272,749 new businesses opened in the last 12 months, up by 2% YoY. Home services openings were 165,006 for the year (up 5% YoY), local services openings were 54,369 (up 3%), professional services openings were 51,839 (up 2%), and auto openings were 34,282 (down 4%).
New Business Openings
April 1, 2020 – March 31, 2021


New Business Openings Increase in States with Decreased Pandemic Restrictions
While many states and counties still enforced COVID-19 restrictions throughout Q1, others eased guidelines or lifted restrictions completely. Nearly every state in the U.S. saw an increase in new openings in Q1 2021, compared to Q4 2020. States with the largest increase in new openings in Q1 compared to Q4 were Mississippi (979 openings, up 39% QoQ), Alabama (1,921 openings, up 35%), Maine (450 openings, up 32%), South Carolina (2,493 openings, up 31%), and Michigan (3,557 openings, up 30%). Each of these states experienced easing of pandemic restrictions, such as allowing indoor dining at 50% or more capacity, and reducing limits on mass gatherings throughout March. The largest counts of openings in the quarter tend to be in larger and more heavily populated states, including California (22,157 openings), Texas (14,860 openings), Florida (14,793 openings), and New York (7,080 openings).
Business Openings Rebounded Across America in Q1
Change in business openings on Yelp, Q1 2021 vs. Q4 2020
Change in Openings, Q1 2021 vs. Q4 2020
-10%
+40%
States that showed the largest QoQ increases for restaurant and food business openings between Q1 2021 and Q4 2020, include, Wyoming (27 openings, up 59%), Alaska (41 openings, up 58%), Kentucky (204 openings, up 44%), Nebraska (68 openings, up 26%), and Maine (73 openings, up 26%). States that showed the largest QoQ increases for professional, local, home and auto services business openings were Mississippi (542 openings, up 63%), Kentucky (847 opening, up 59%), South Dakota (99 openings, up 46%), Michigan (1,770 openings, up 43%), Maine (230 openings, up 42%) and Minnesota (775 openings, up 40%).
Business Reopenings Rise Across the Country in Q1, Reach Highest Levels Since Summer 2020
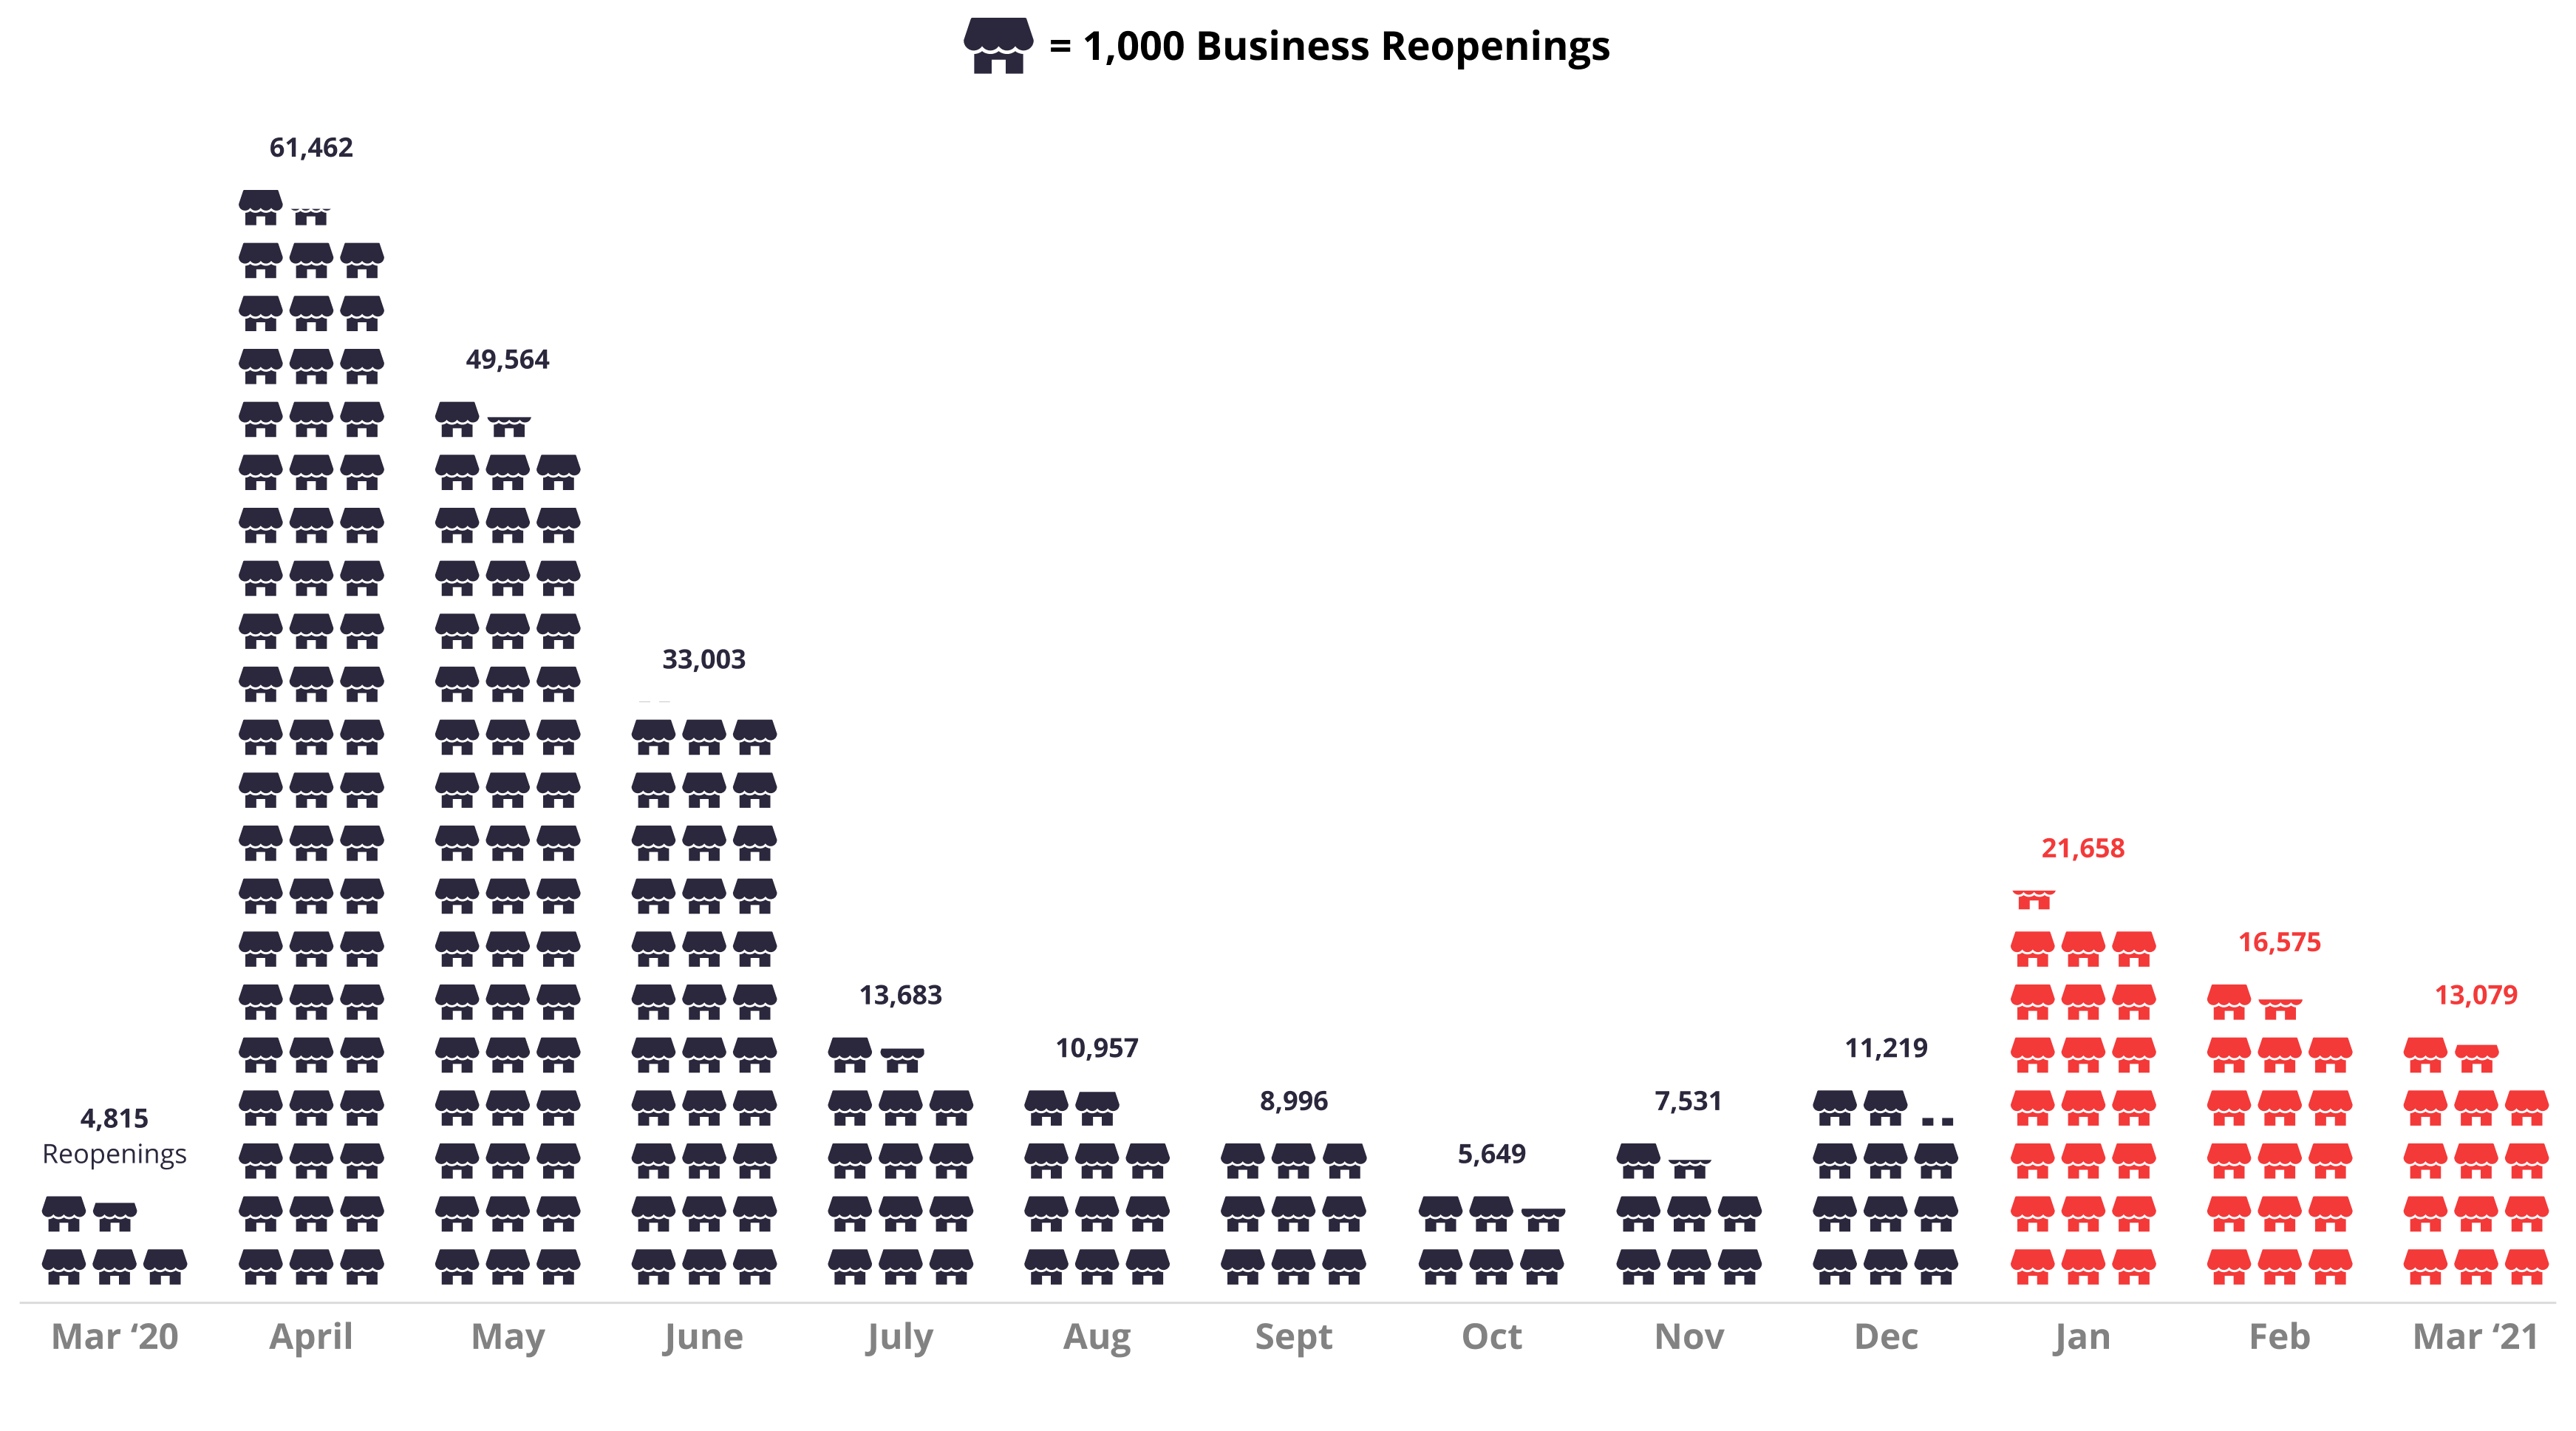
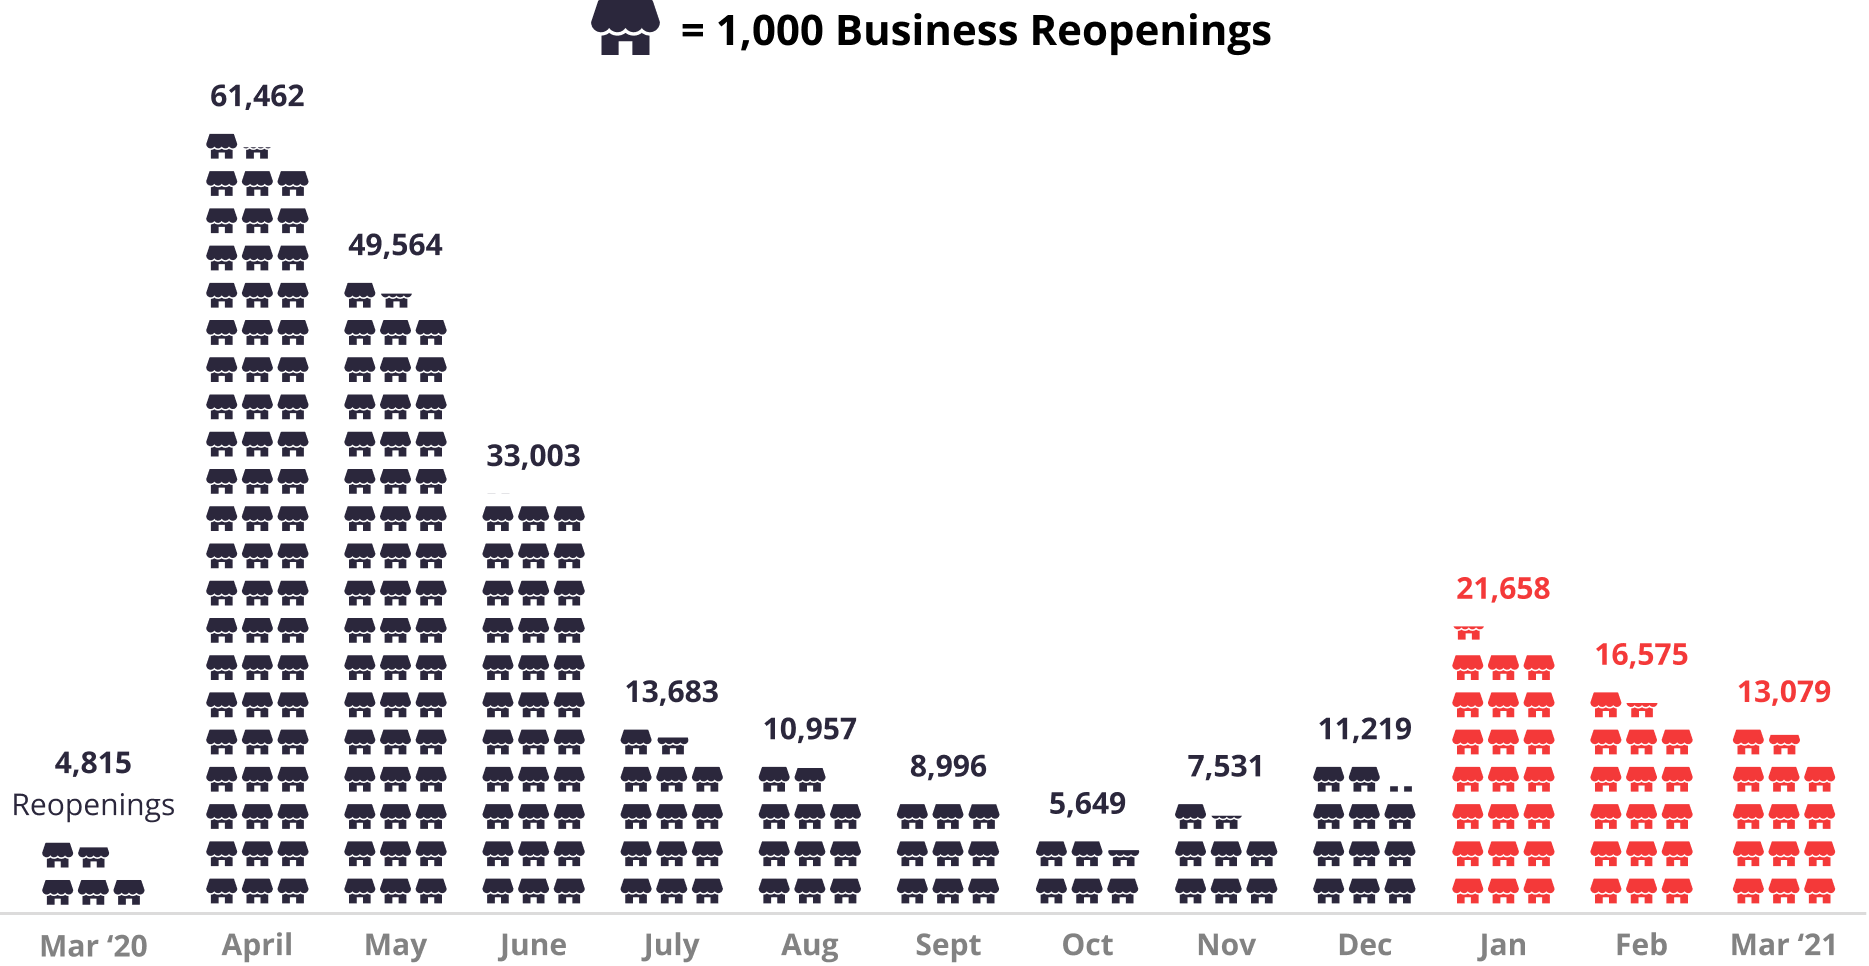
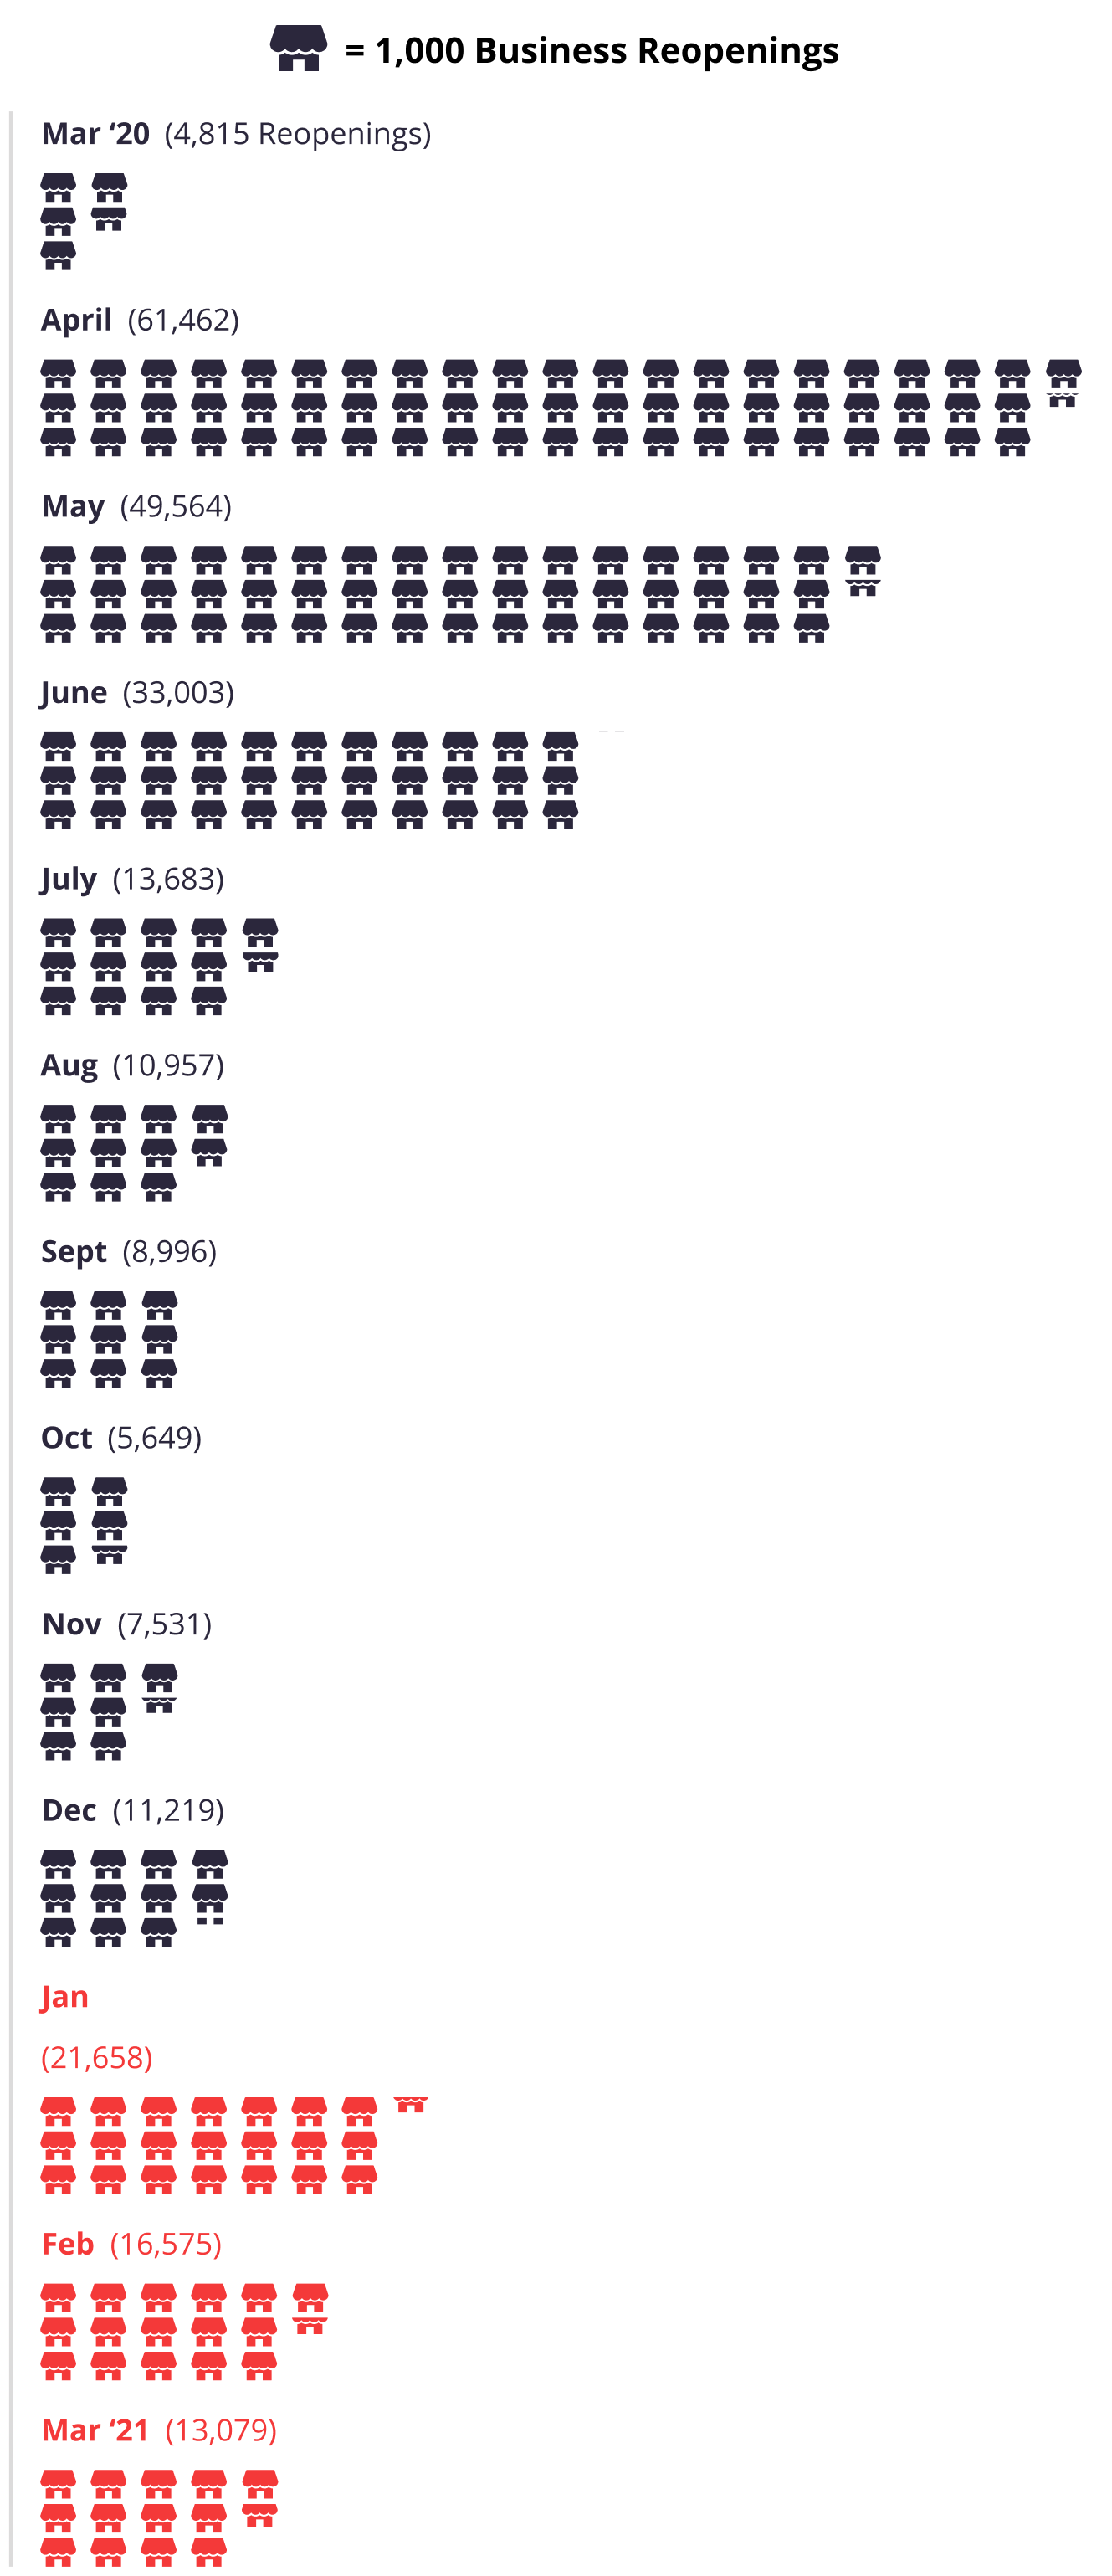
As COVID-19 cases continue a downward trend in most states across the U.S., business reopenings have accelerated. The total reopenings since March 1, 2020 climbed to 258,191 up from 230,209 as of December 31. Reopenings in each month of the first quarter were the highest they have been since August 2020. As heavy restrictions lifted, national reopenings picked up early in the quarter. January saw the highest number of reopenings in the quarter, and while reopenings slowed in each subsequent month of Q1, March reopening levels still remained high.
Business Reopenings Spike in Q1
National business reopenings by month, Mar 2020 – Mar 2021
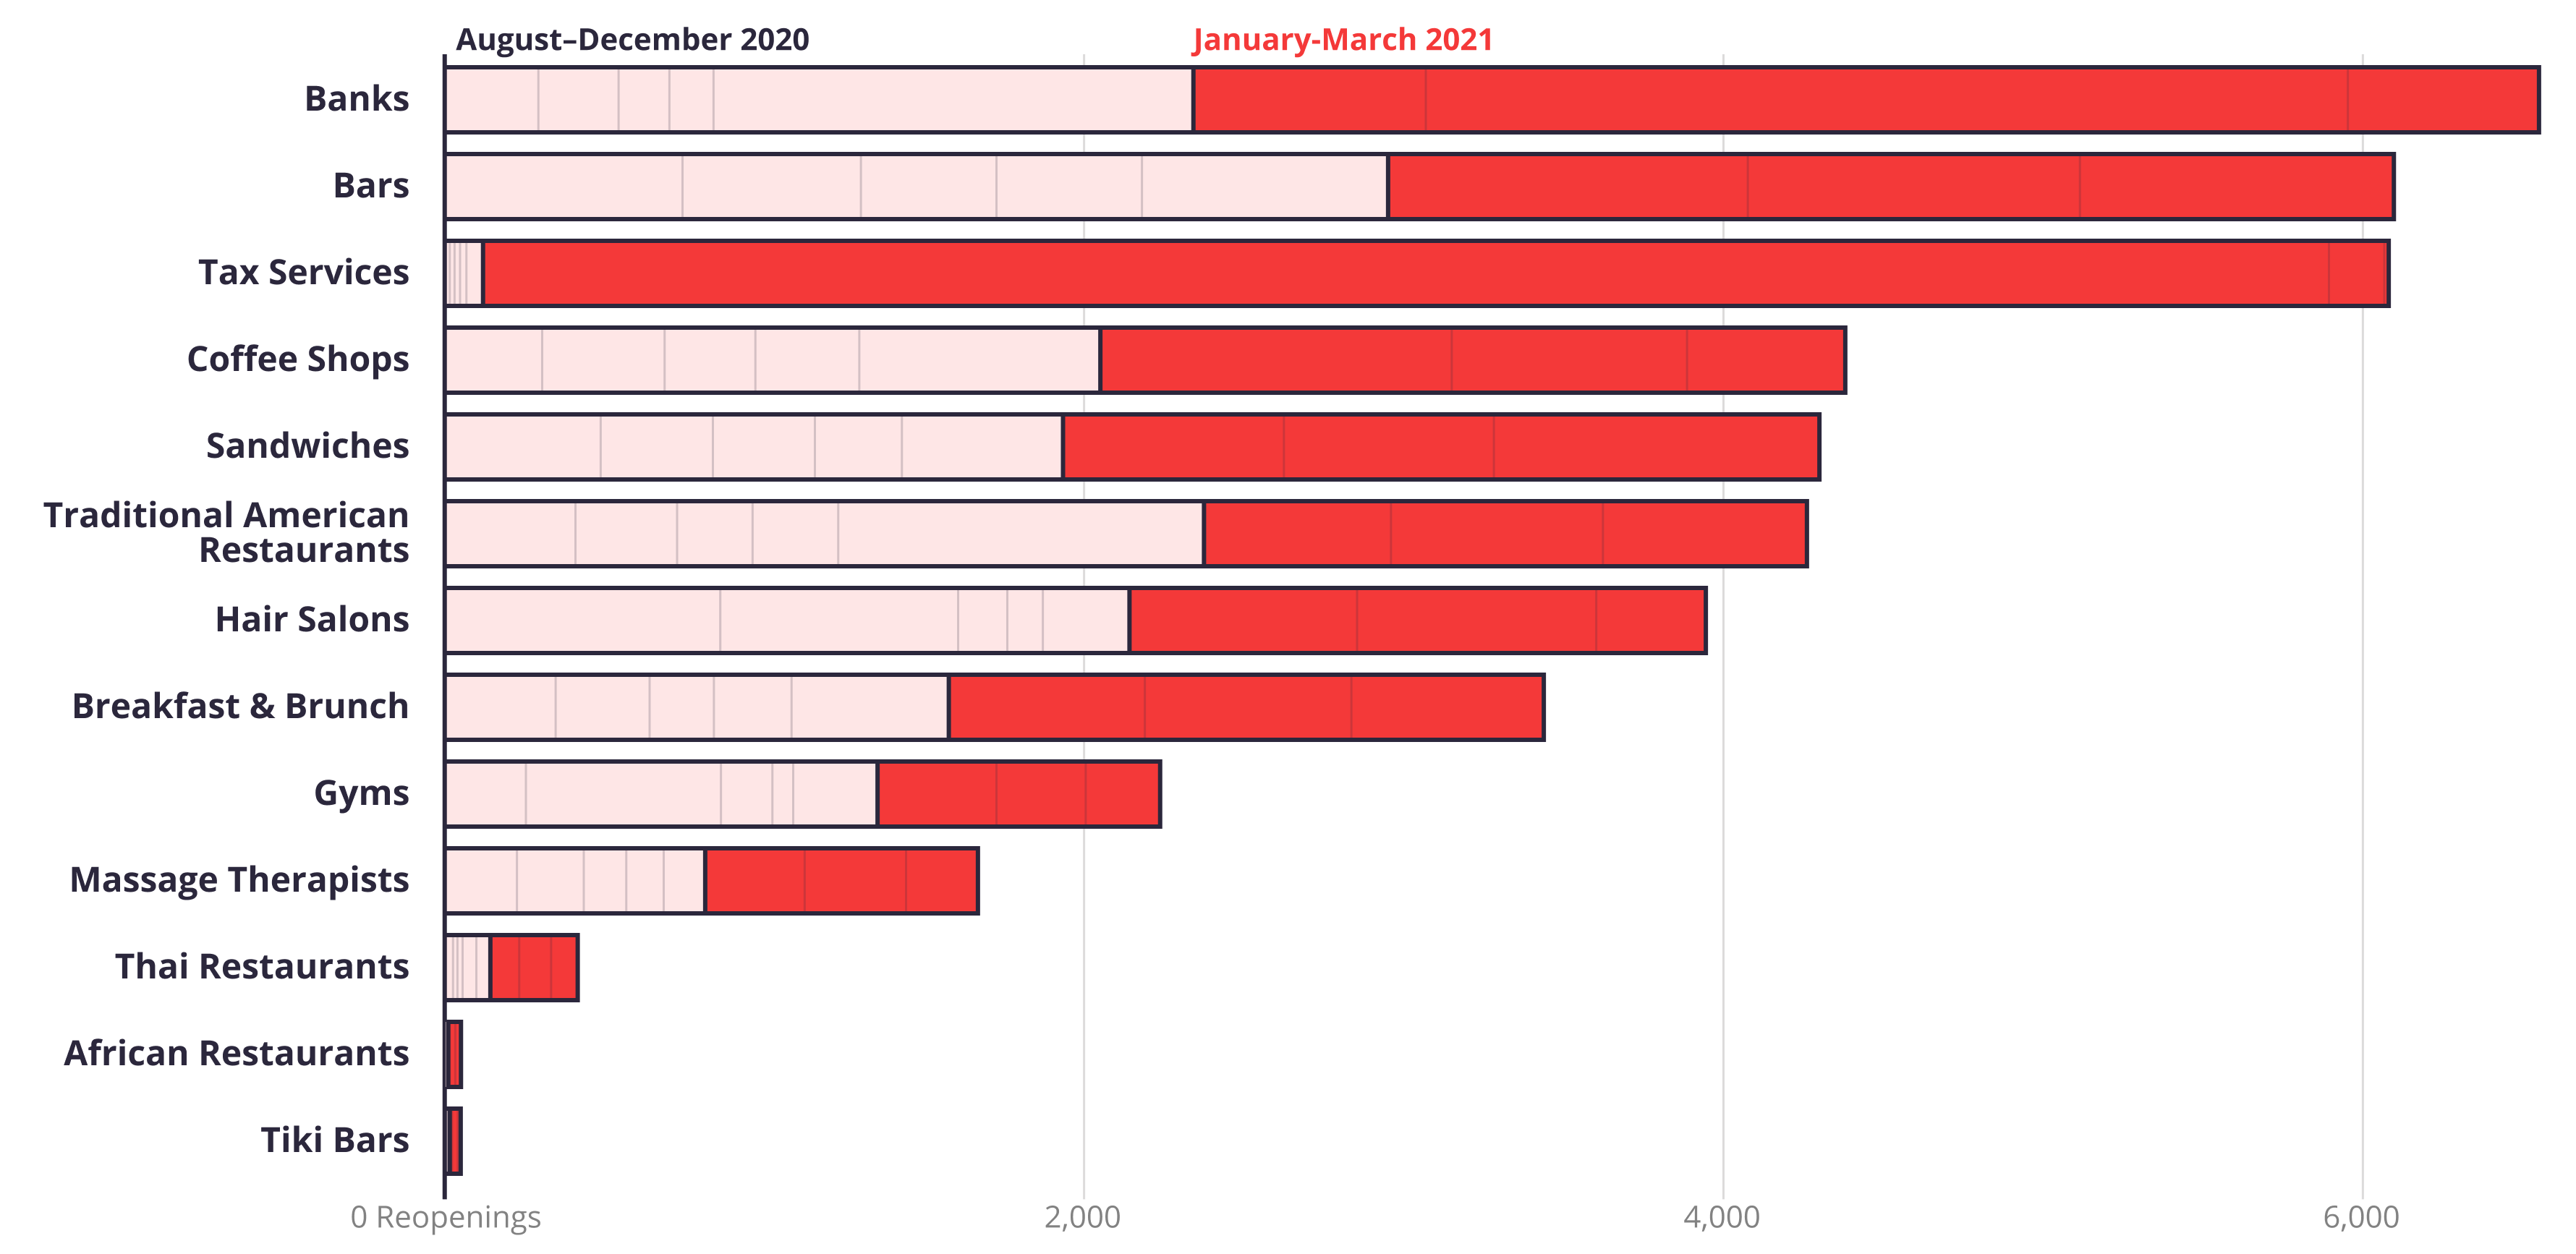
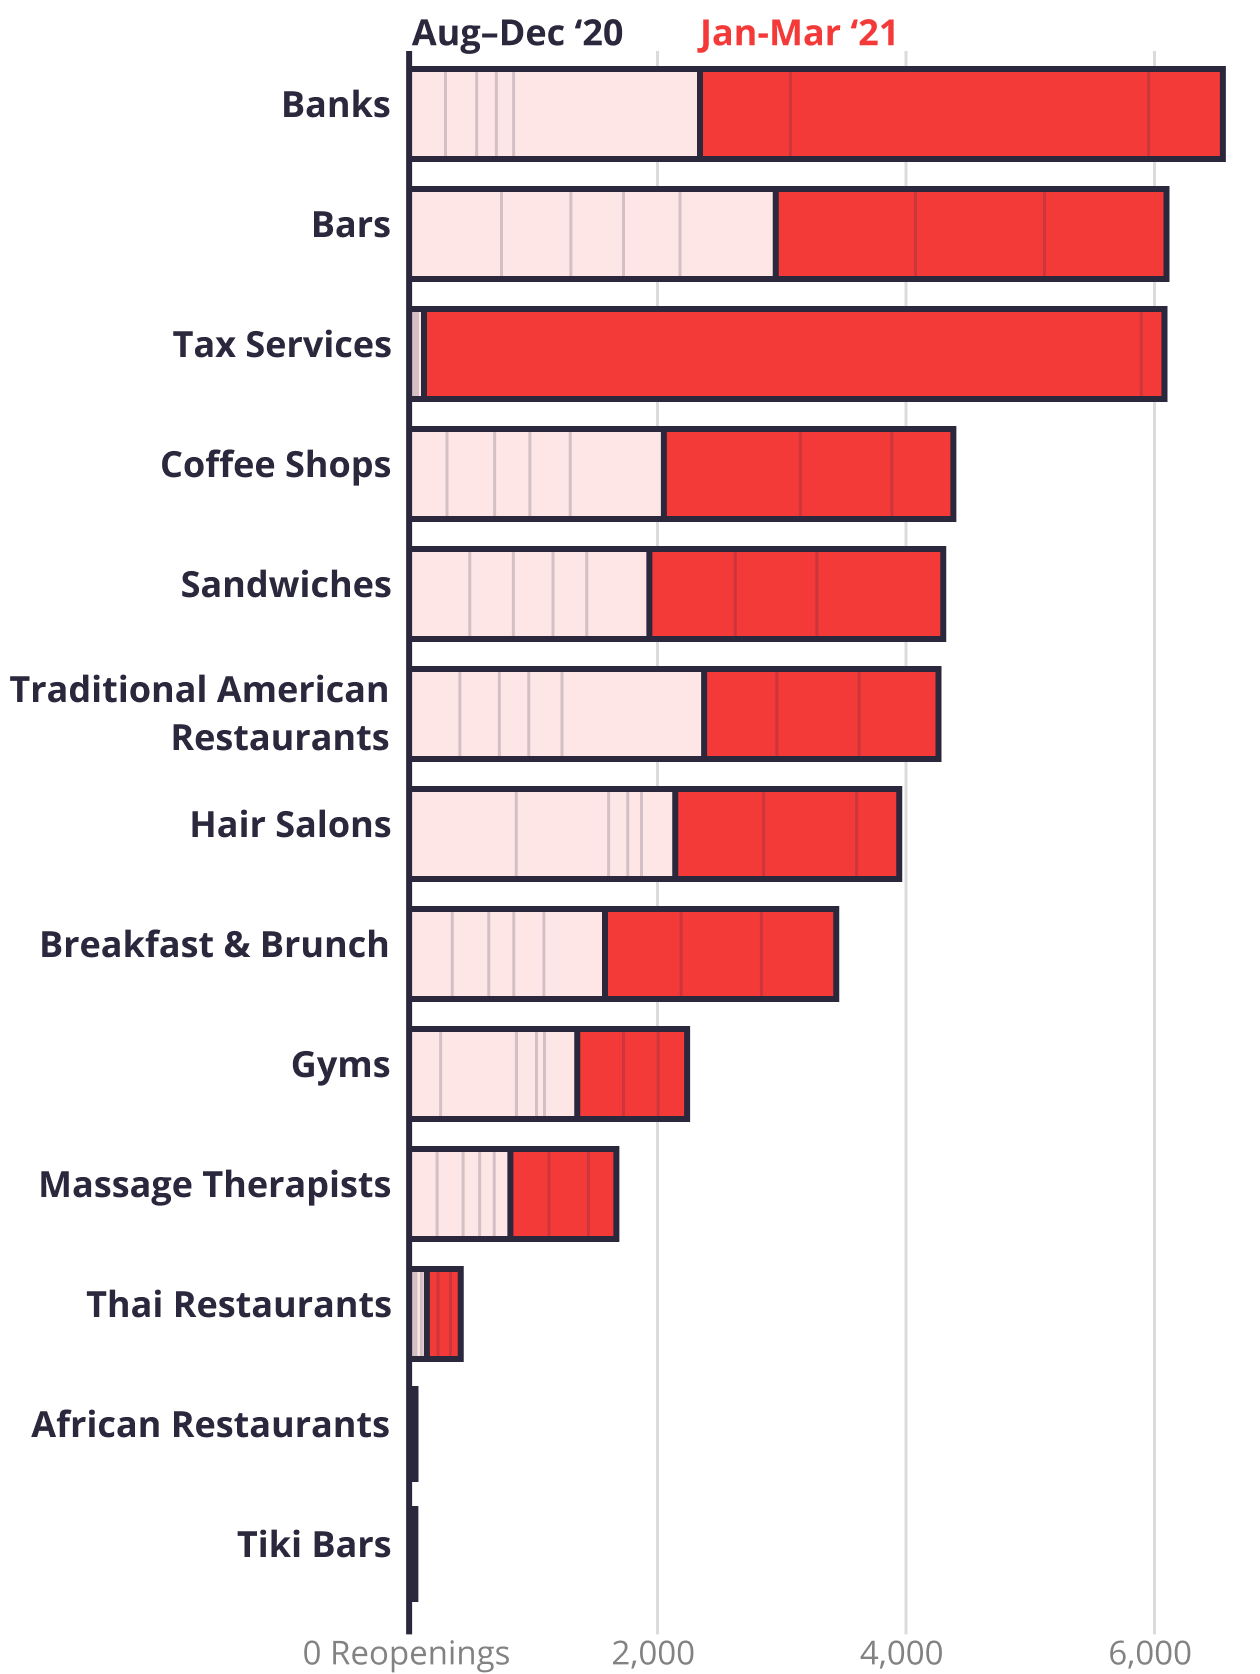
Although reopening varied across the country, nationally some categories experienced their highest rate of reopenings in Q1 – tax services (5,961 reopenings), bars (3,146 reopenings), sandwich shops (2,366 reopenings), coffee houses (2,330 reopenings), breakfast and brunch spots (1,861 of reopenings), and massage therapists (853 openings) all experienced more than 50% of their reopenings in Q1, since August 2020. Other categories had over 40% of their reopenings in Q1, since August 2020, such as traditional American restaurants (1,886 reopenings), hair salons (1,803 reopenings), and gyms (884 reopenings).
Some Categories Experienced an Increase of Reopenings in Q1
Number of reopenings since August 2020 on Yelp for select categories

Due to the wide-ranging nature of COVID-19 responses throughout the nation, the following states experienced over 65% of their reopenings in Q1 2021, since August: Arkansas (302 reopenings), Delaware (140 reopenings), Mississippi (287 reopenings), Maryland (951 reopenings), Tennessee (872 reopenings), and Texas (5,331 reopenings).
Consumer Interest Changes Indicate High Interest in Real Estate and Home Projects, New Outdoor Activities and More Across the U.S.
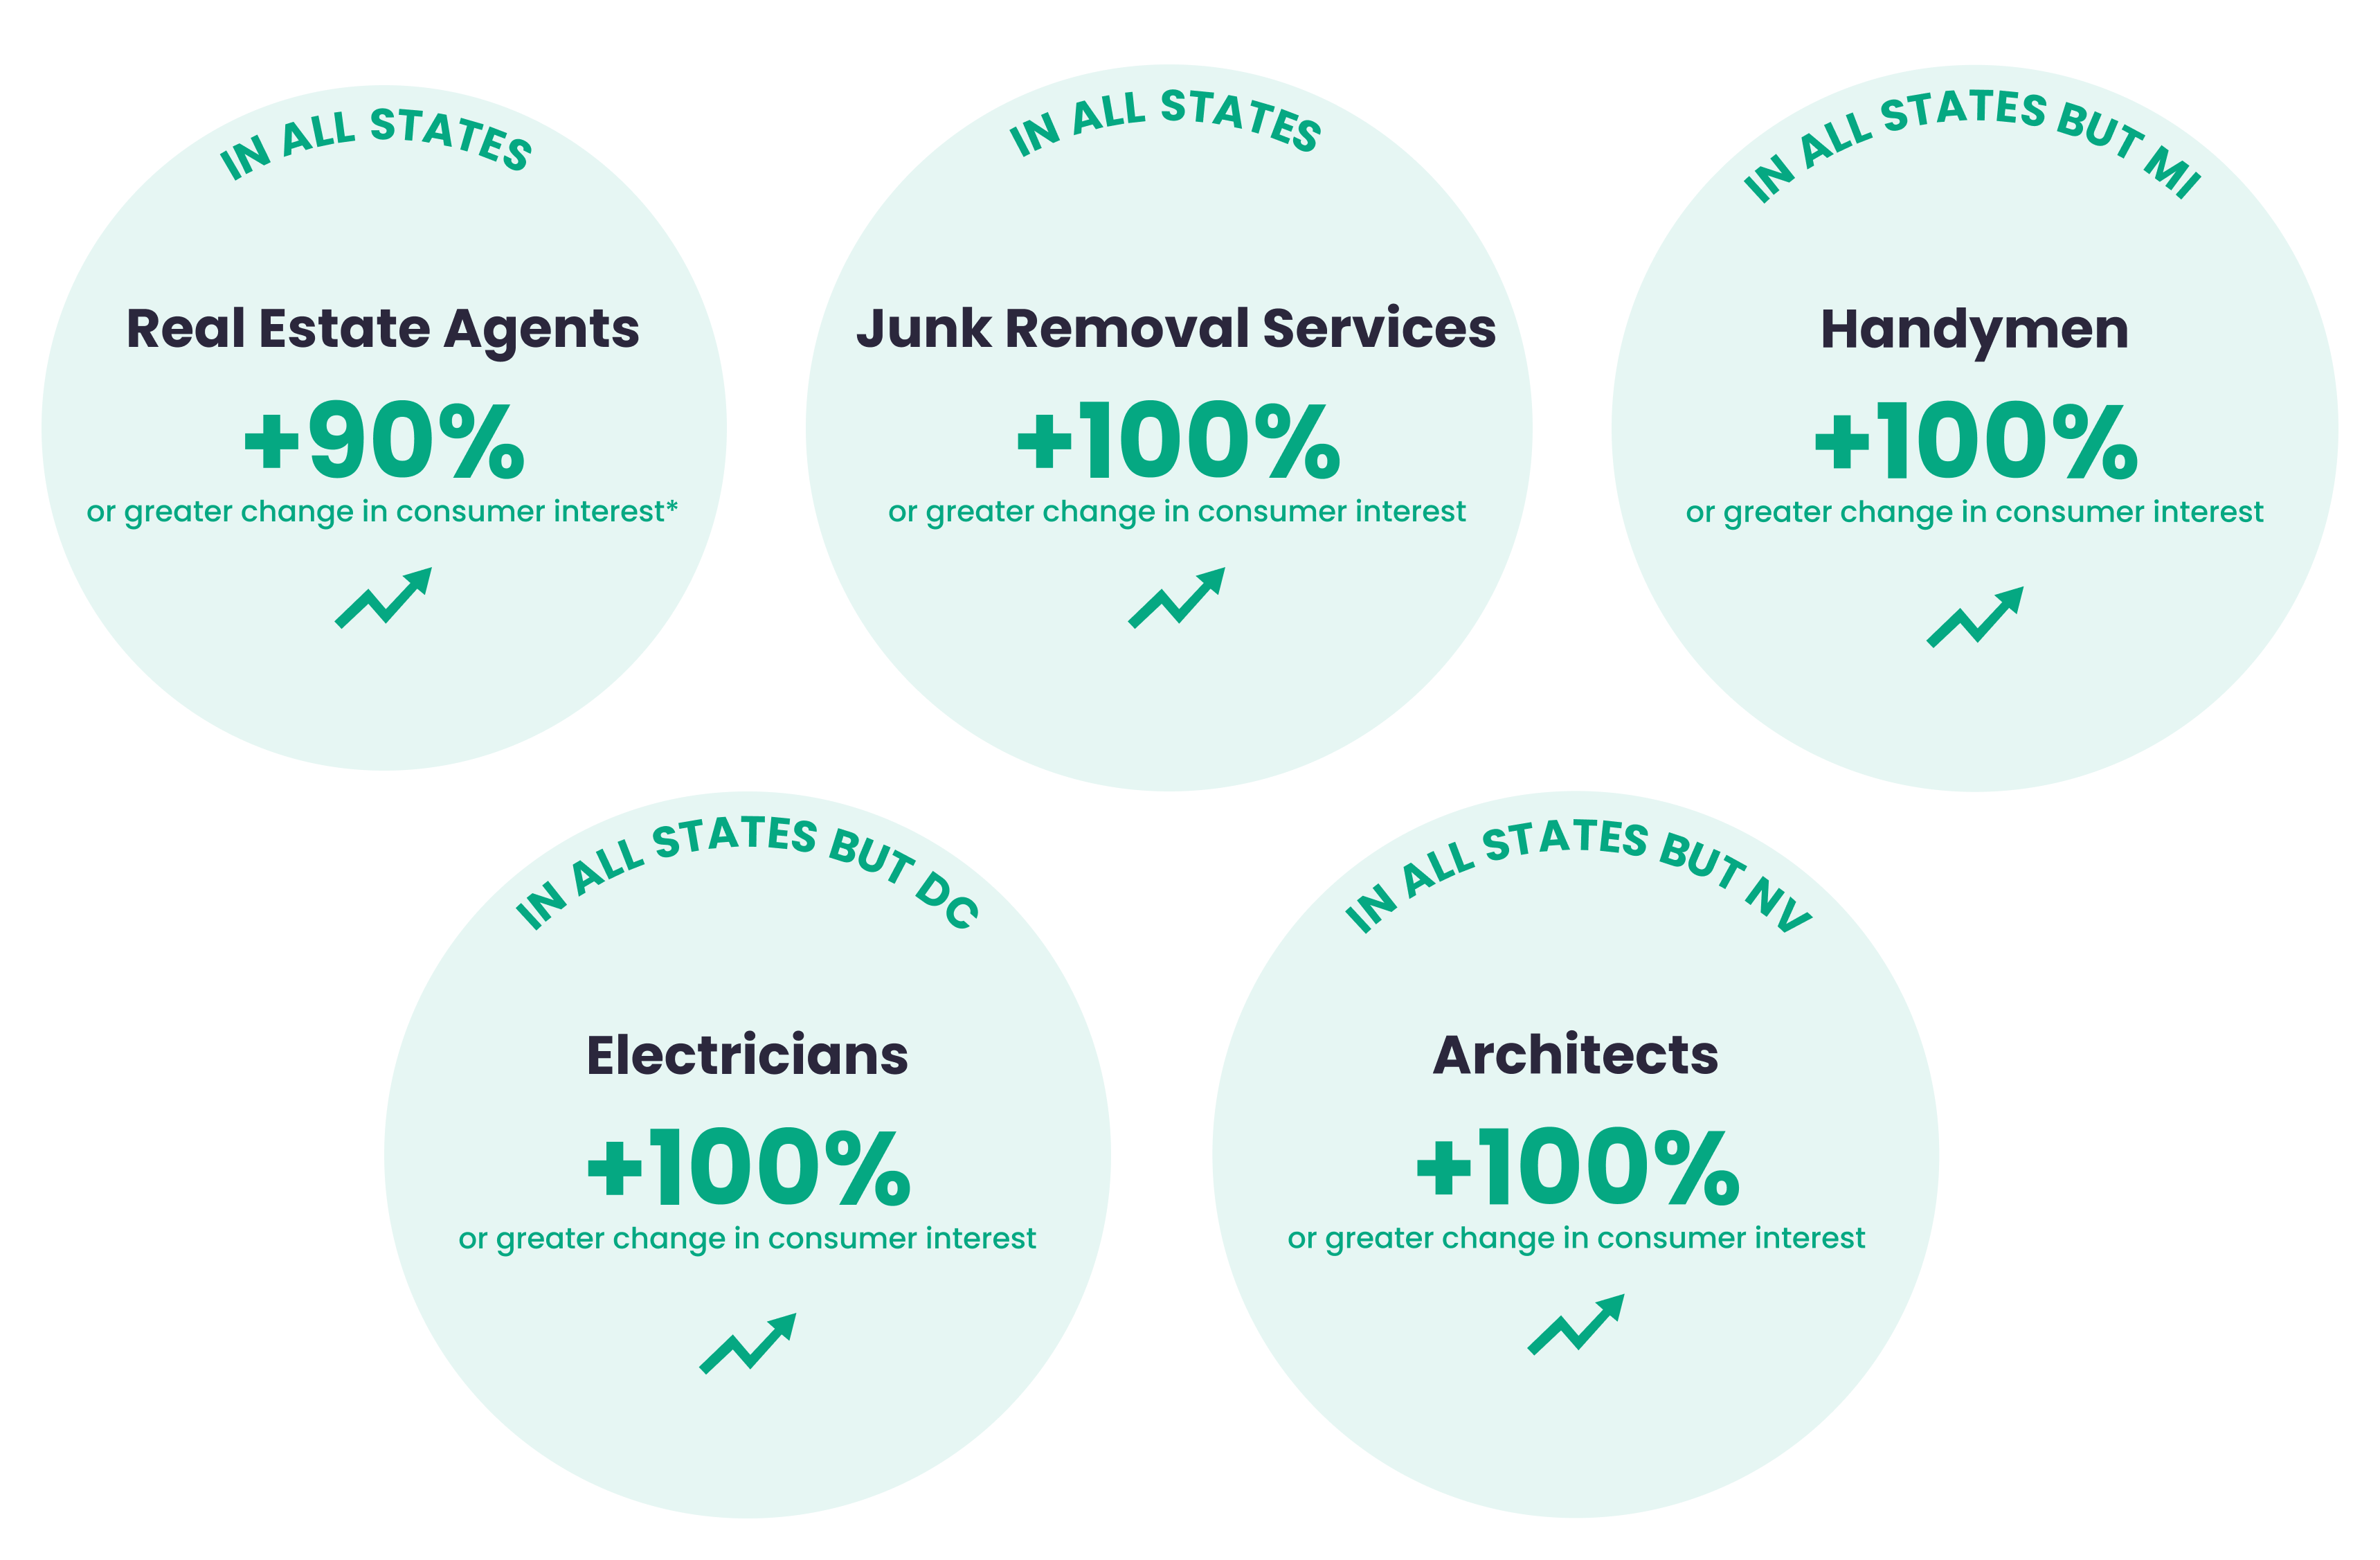
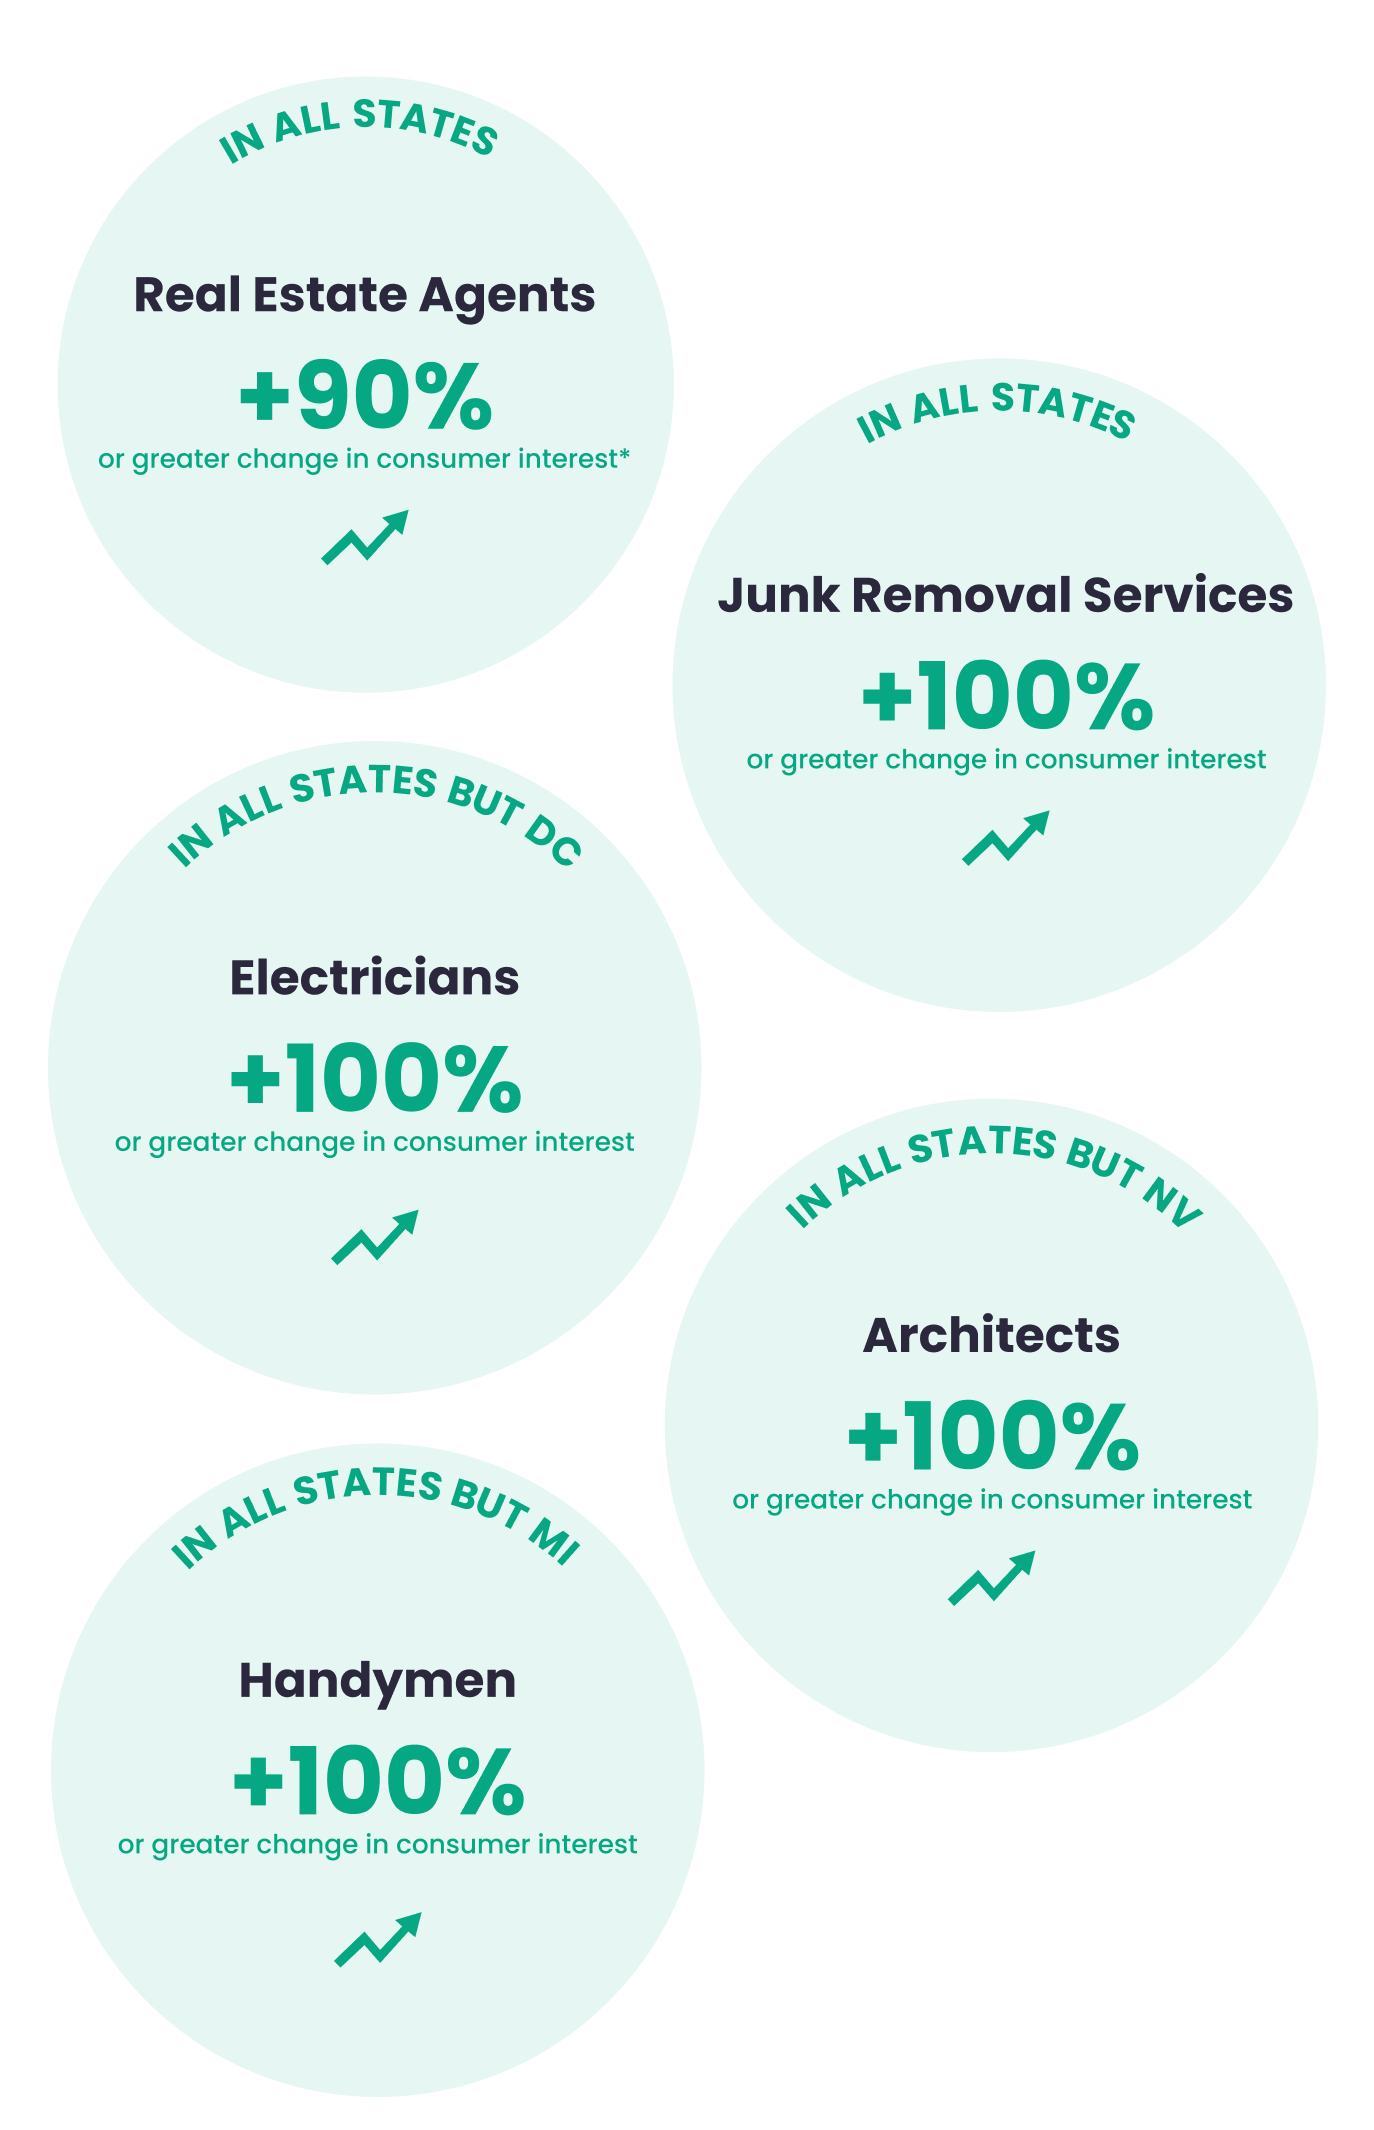
People across the U.S. have been focused on their homes – whether buying a new property or improving their current space. Every state in the U.S. saw more than a 90% increase in consumer interest for real estate agents compared to Q1 2020. In preparation to move or declutter, consumer interest for junk removal services was up by more than 100% in every state. Consumers are investing heavily in their homes, taking on larger, more intensive home renovation projects, as consumer interest in architects was up 100% compared to Q1 2020 in every state except Nevada. Consumer interest increased by more than 100% for electricians in every state except for DC, and interest in handymen increased by more than 100% in every state except for Michigan, which saw a 68% increase.
Consumers are Focused on Buying and Improving Their Homes Across the U.S.

Experiences reminiscent of traveling, while staying local, were trending in Q1 compared to the year prior, as consumer interest for wineries, international grocery stores, and African restaurants increased in a variety of regions. Several states had more than a 700% increase in consumer interest for international grocery stores (Washington, DC; New York; Nebraska; North Carolina; Connecticut; Kentucky; Georgia; Ohio; and Florida) from Q1 2020. Consumer interest in wineries increased over 300% from Q1 2020 in Wisconsin, Washington, Wyoming, New York, Massachusetts, Alabama, California, Minnesota, and Montana.
Consumers are still looking for new outdoor activities in many states. More than 35 states experienced an increase in consumer interest for horseback riding – California, Idaho, Oregon, Hawaii, Washington, and Louisiana saw increases of more than 2,000% from Q1 2020. Pickleball experienced a resurgence of recent interest with increases of over 200% in Missouri and Kansas from Q1 2020. Some states went off-road, literally, where consumer interest in ATV rentals increased by more than 500% in Vermont, Wyoming, Colorado, and Arizona. Meanwhile, consumer interest in bike rentals, an outdoor category that was popular early in the pandemic, decreased by more than 100% in 26 states from Q1 2020, led by Iowa (down 7,038%), New York (down 1,916%), and Washington, DC (down 1,237%).
In preparation for a less isolated spring season, personal services such as laser hair removal saw a 787% increase in consumer interest in New York and interest in cosmetic surgery increased by 300% in Hawaii, New York, California, and Florida.
Consumer Interest Begins to Return to Pre-Pandemic Activities
As the U.S. flattened the curve in January and vaccine distribution ramped up in Q1, many regions began to lift some restrictions on business capacity and indoor activities. To observe which activities consumers were returning to or leaving behind, Yelp compared consumer interest from December 2020, as the baseline level of interest, to various periods in Q1. Some industries that saw an increase since December have since declined, while others have sustained an elevated level of consumer interest through Q1.
As measured by a seasonally adjusted share of its root category, as people began their New Year’s resolutions, consumer interest in fitness and exercise equipment rose 18% in January and has since returned to about 25% below the baseline level of interest in March. People also kicked off the New Year getting married and adopting pets, as wedding chapels and pet insurance followed a similar trend. Yelp data also shows interest for guns and ammunition spiking in January and then falling later in the quarter.
Meanwhile, we saw interest in nail salons decrease since December, dropping 9% early in January, but later rising 8% in March, now only down about 1% relative to December. Car brokers, game meat shops, motorcycle rentals, and driving schools have all experienced similar trends.
Other industries have been able to sustain their increase in consumer interest December through March, including childcare, boat tours, art installation, and architects.
Consumer Interest in Categories Has Shifted Since December
Change in share of consumer interest on Yelp for select categories
Rising Interest
Recovering Interest
Declining Interest
— Jessica Mouras and Carl Bialik contributed to this report.
If you'd like additional detail on how the economy is shifting, please contact us at press@yelp.com or join our mailing list to receive an email when new reports are released.
Interested in learning how Yelp data can assist you in developing market insights for your business? Yelp Knowledge can help, learn more here.
Methodology
New Business Openings
Openings are determined by counting new businesses listed on Yelp, which are added by either business owners or Yelp users. Openings are adjusted year-over-year, meaning openings are relative to the same period of time in the previous period for the same category and geographic location. This adjustment corrects for both seasonality and the baseline level of Yelp coverage in any given category and geography.
Business Reopenings
On each date, starting with March 1, 2020, we count U.S. businesses that were temporarily closed and reopened through March 31, 2021. A reopening is of a temporary closure, whether by using Yelp’s temporary closure feature or by editing hours, excluding closures due to holidays. Each reopened business is counted at most once, on the date of its most recent reopening.
Openings and reopenings are based on when they're indicated on Yelp, as such, the data may lag slightly from the true opening or reopening date due to a delay in reporting from consumers and business owners.
Resilience
Community resilience compares the rate of business openings per state from Q2 to Q3 in 2020 and adjusts for the natural rate of openings in 2019 to determine how well states have rallied to foster new businesses during the pandemic.
Mathematically, resilience is calculated as Q3 YoY adjusted openings less Q2 YoY adjusted openings divided by Q2 YoY adjusted openings. YoY adjusted openings are openings this year divided by openings last year (for any given month/quarter etc.).
Consumer Interest By Business Category
We measure consumer interest, in terms of U.S. counts of a few of the many actions people take to connect with businesses on Yelp: viewing business pages or posting photos or reviews.
Consumer interest for each category is based on the Q1 2021 year-over-year change in the category’s share of all consumer actions in its root category.
Baseline levels of interest for changes from Q4 2020 to Q1 2021 were measured between December 1 and December 31, 2020, corresponding to the announcement of FDA approved vaccinations. We now measure consumer interest levels normalized by their average value over the baseline through March 31. As such we measure consumer interest in these categories – relative to the December, “start of official recovery”, baseline level of interest. This is a good general indicator of consumers' path towards reverting to the norm and becoming more active economically and socially.
To measure seasonally adjusted daily consumer interest we start with the biggest U.S. categories by consumer actions. Among those, we select the biggest gainers and biggest decliners in terms of their share of all root category consumer actions since December 1. Then we choose representative ones to show the trend, which we’re charting from December 1, 2020 through March 31, 2021.
Downloadable static graphics can be found here.
See Yelp's previous Coronavirus Economic Impact Reports at our Data Science Medium, Locally Optimal.


