Q3 2021
More than 5 in 6 Temporarily Closed Businesses Reopen as Local Economies Adapt to Operating During the Pandemic, According to the Yelp Economic Average
For more on the methodology for this report, click here.
Economic activity in the first half of 2021 indicated the US is recovering from the pandemic lows of 2020. After a surge in COVID cases in Q3, the impact of the delta variant on businesses appears to have been less drastic than originally forecasted – after a slight dip in August, hiring and retail sales picked up in September. Local governments are also doing their part to ensure that businesses are able to continue to serve their communities safely – with cities like San Francisco, New Orleans and New York City implementing vaccine requirements for indoor businesses like restaurants and gyms to help reduce transmission of the virus.
Yelp data for Q3 2021 points to a growing adaptability among local businesses operating under “new normal” conditions due to the pandemic. The vast majority of businesses that experienced a temporary closure during the pandemic have reopened. New business openings and consumer interest increases reflect consumer demand for leisure activities upended by early pandemic restrictions.
Majority of Temporarily Closed Businesses in the US Have Reopened as of Q3
Yelp data provides a detailed look at the pandemic’s impact on local economies with granular insight into temporary business closures and reopenings. In Q3 2020, we began reporting business reopenings as several states and cities loosened restrictions to allow businesses to resume indoor operations. A year later, the level of reopenings decreasing in raw count and volume signal that local economies are successfully adapting to the change and temporarily closed businesses are increasingly becoming less prevalent.
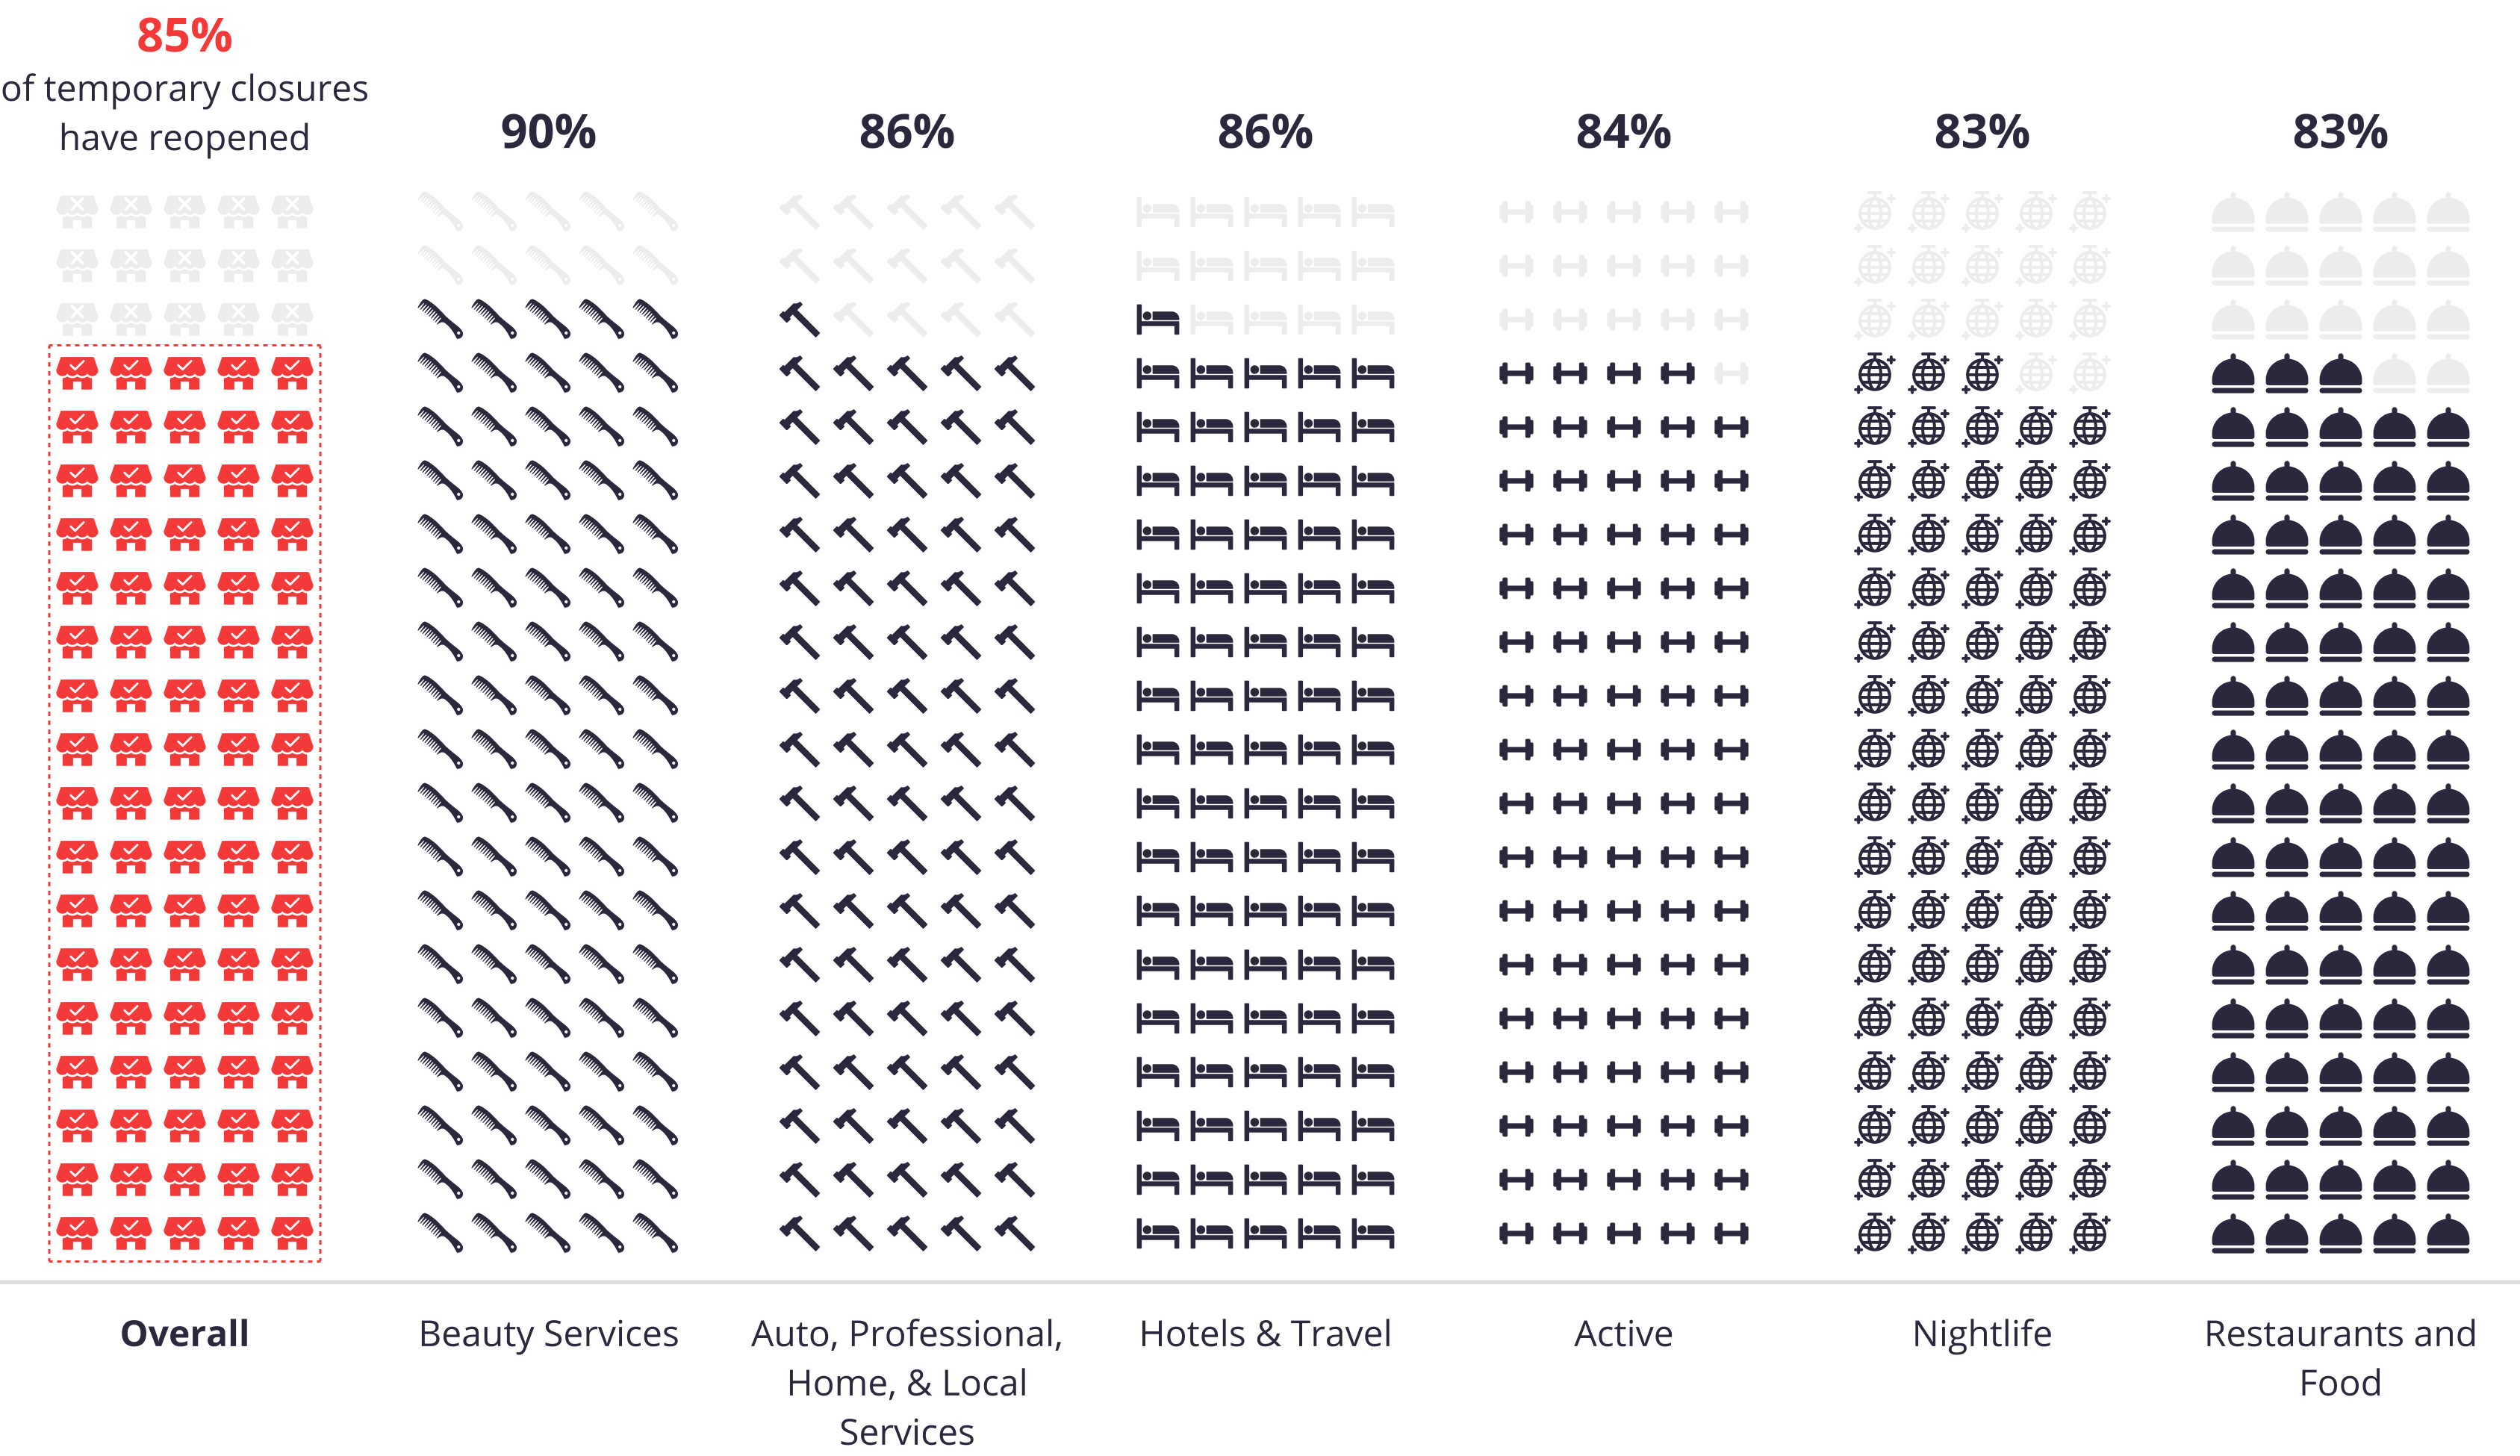
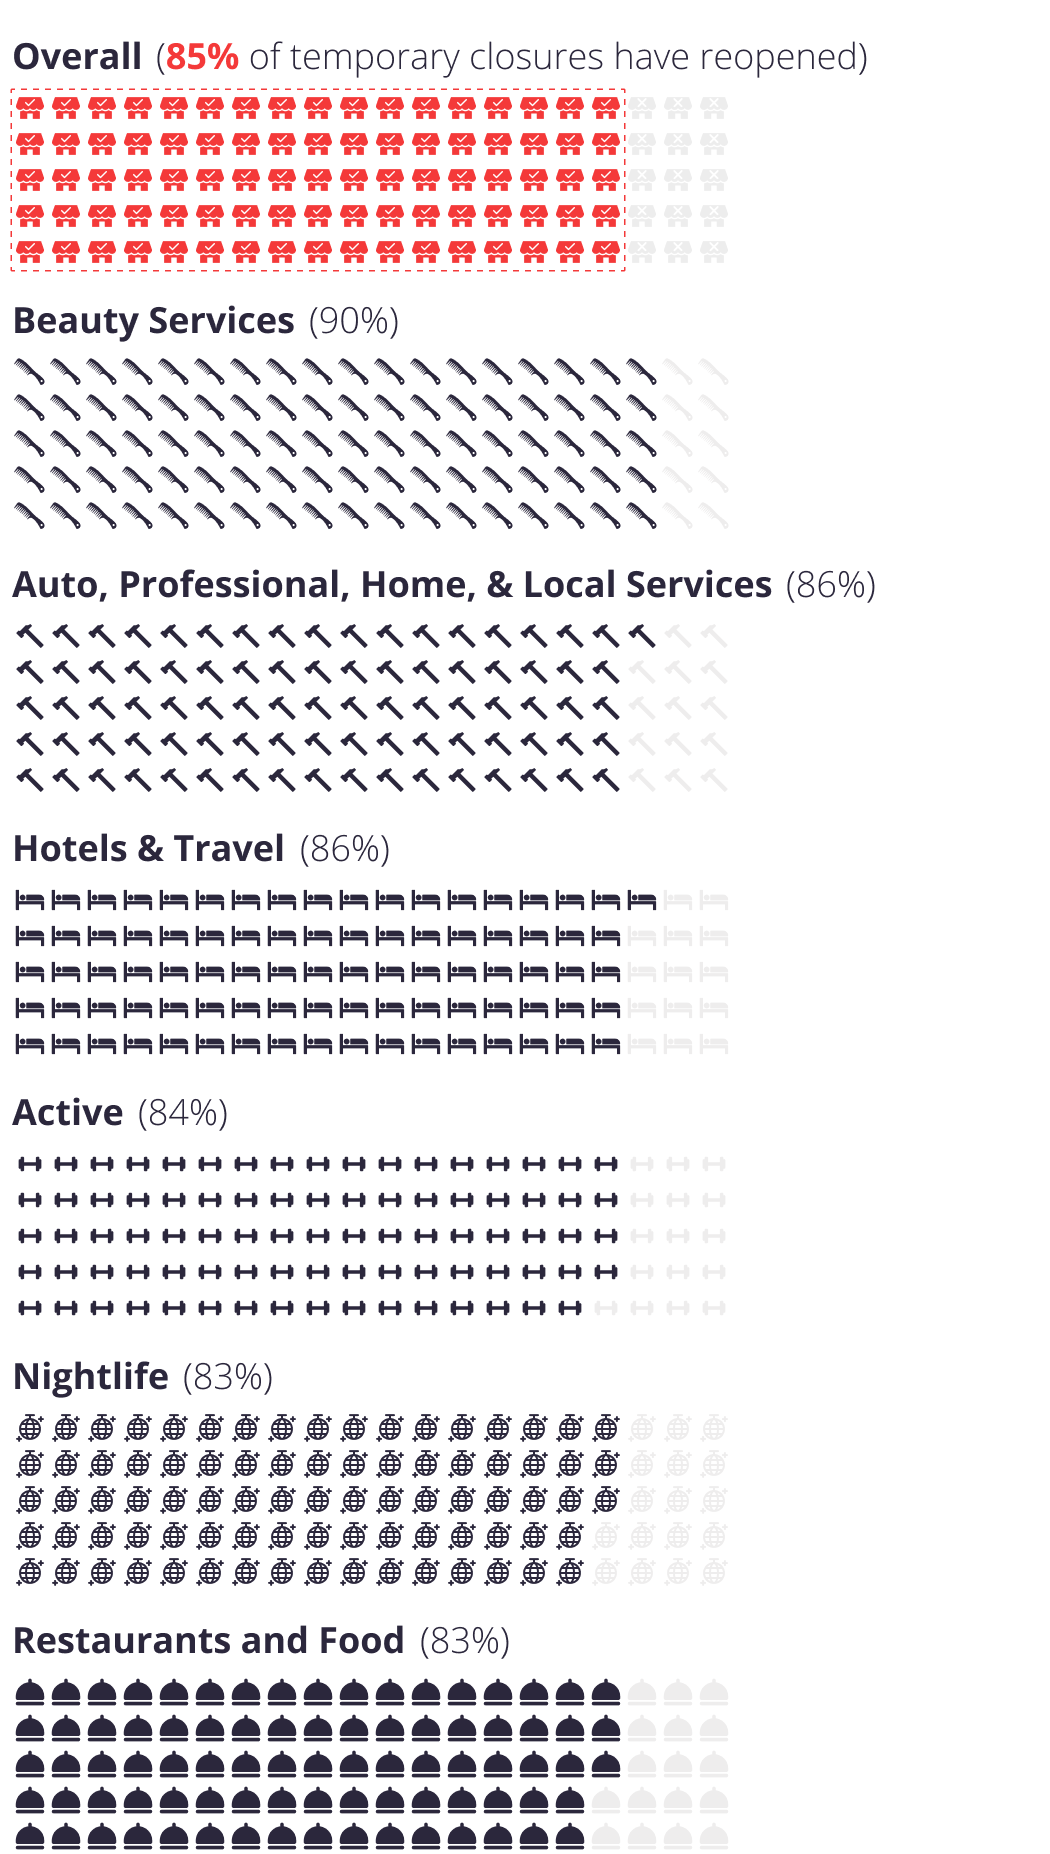
Of all the businesses that temporarily closed in the U.S. since the onset of the pandemic (March 2020) through Q3 2021, 85% have reopened as of September 30.
The Vast Majority of Temporarily Closed Business Have Reopened
Share of temporarily closed businesses that have reopened as of September 30


Businesses Related to Leisure, Hospitality and Beauty Help Drive New Businesses Growth
In Q3, the US services industry experienced a continued increase in the number of available jobs, with a majority of those jobs concentrated in hospitality and leisure. Yet the industry is still struggling to attract workers, making it increasingly difficult to keep up with demand.
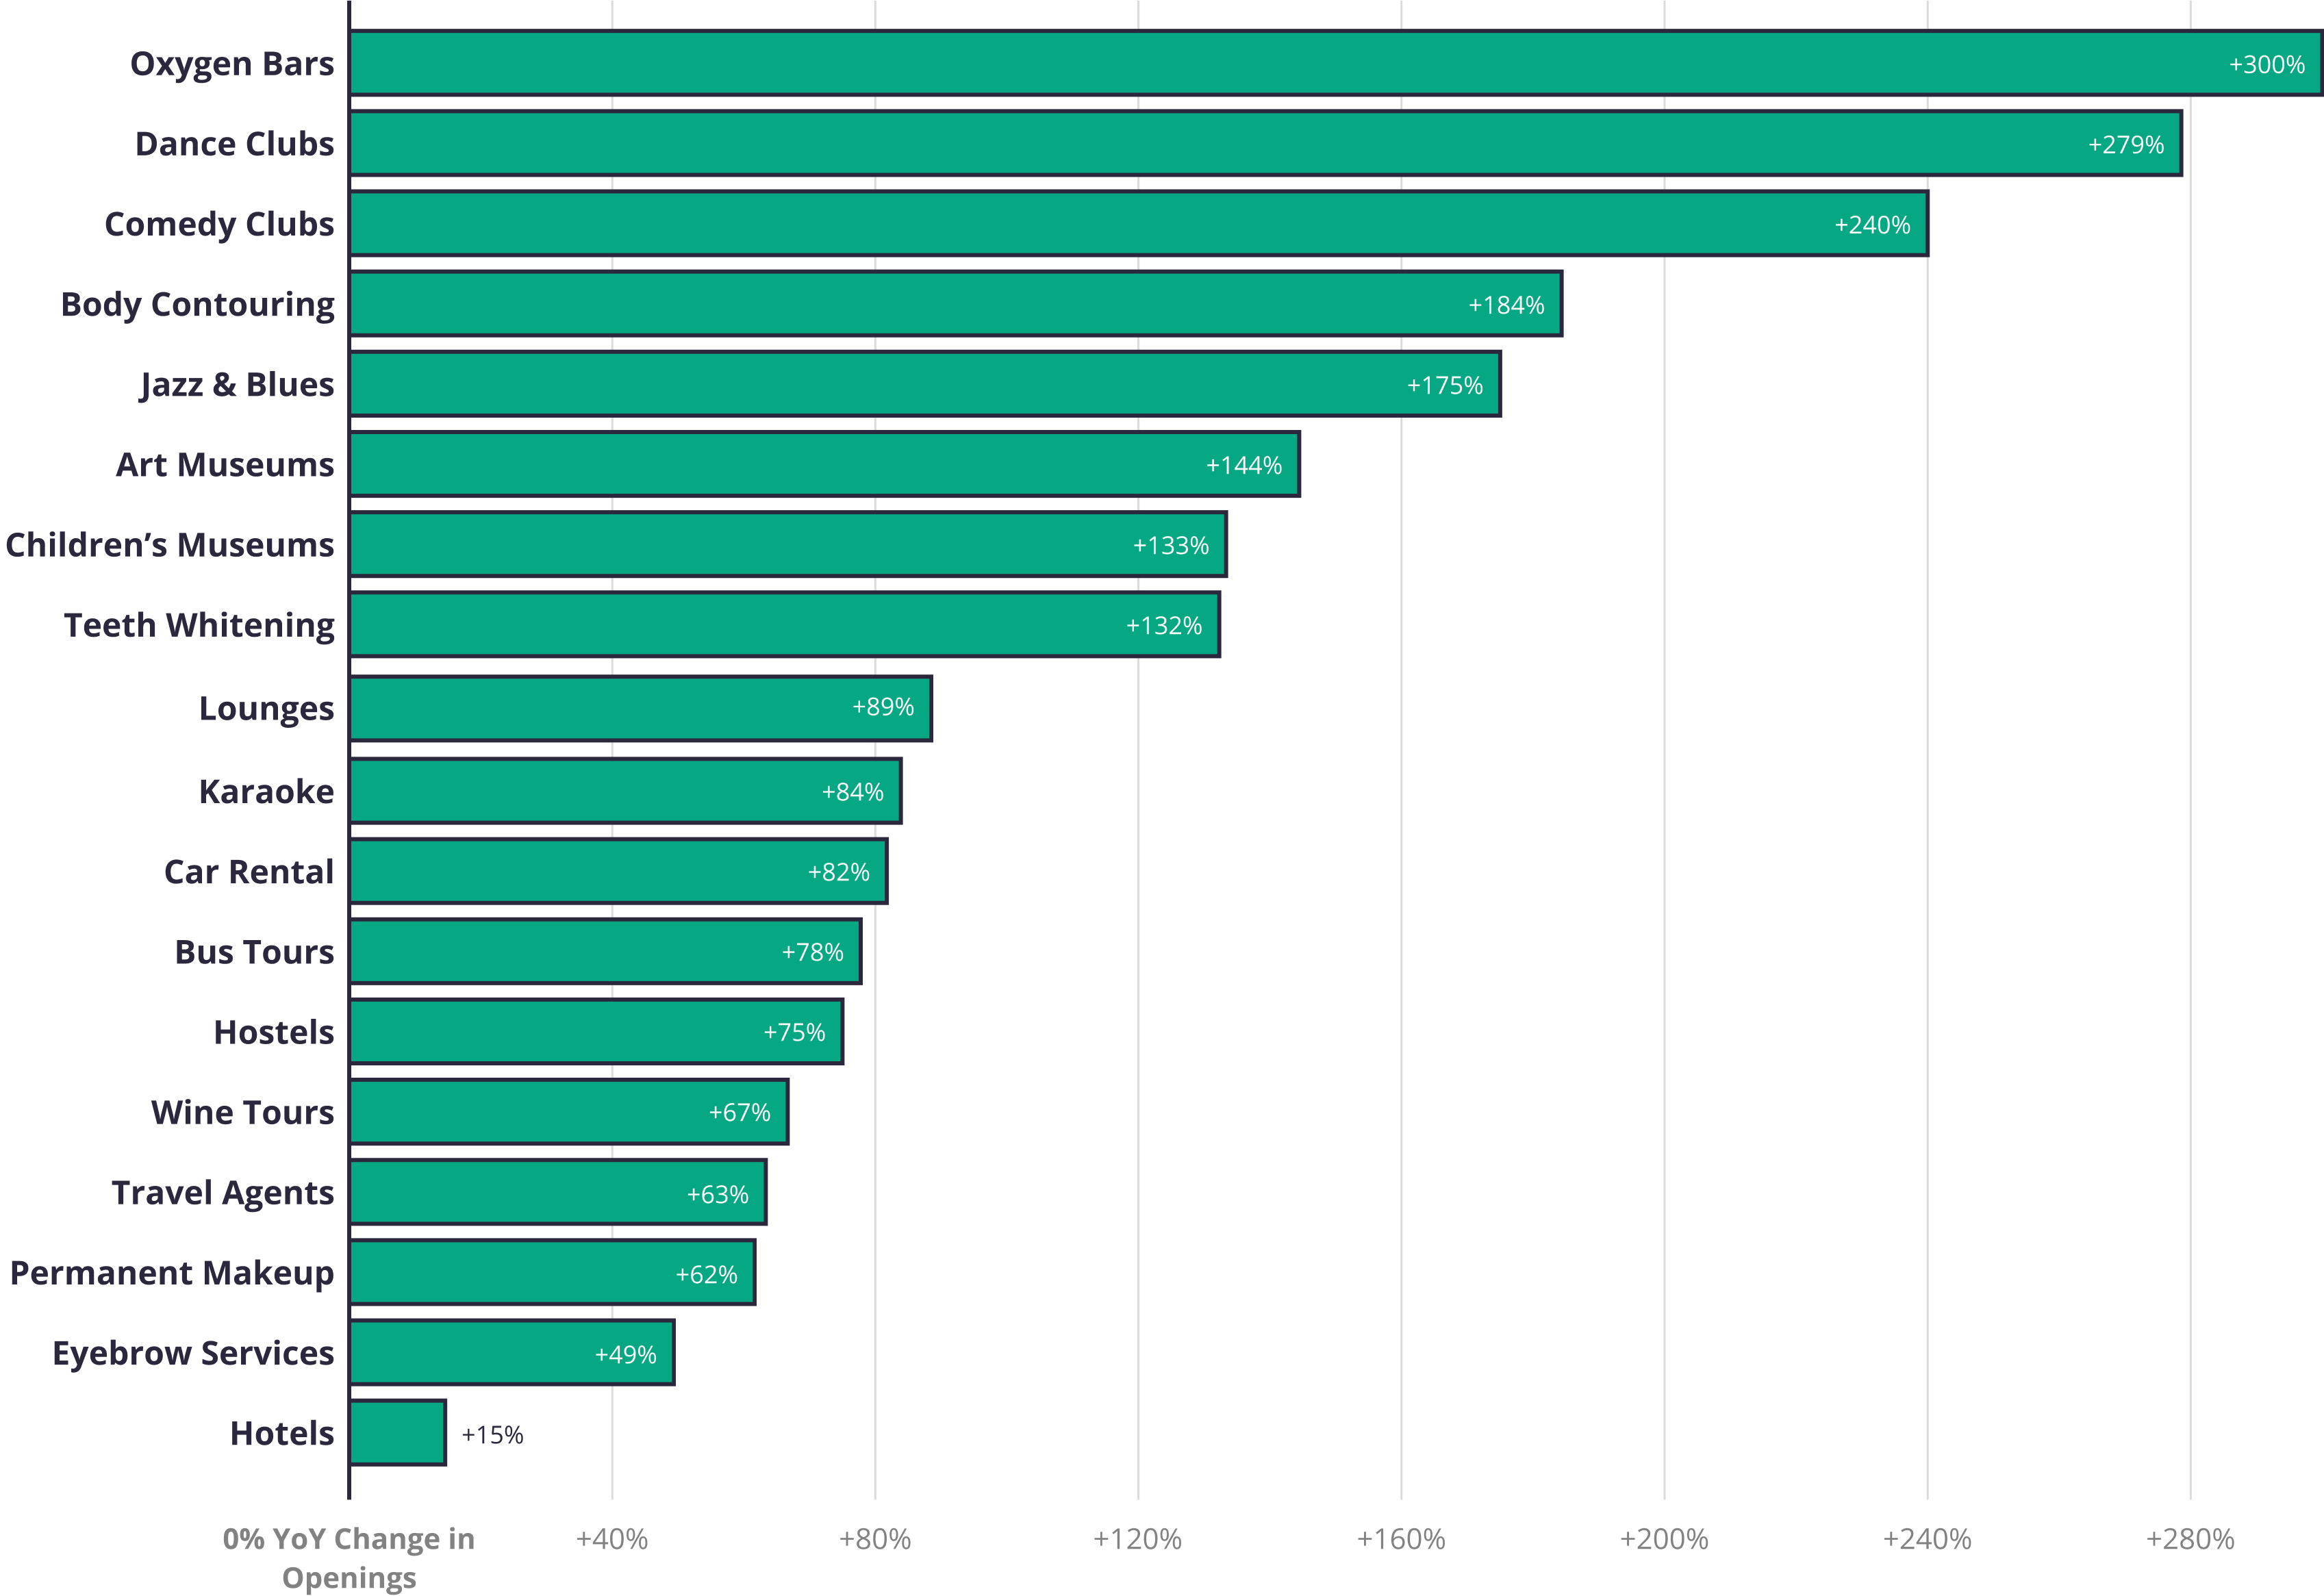
Similarly, new business openings in leisure and hospitality on Yelp increased in Q3 2021 compared to Q3 2020. Hotels accounted for 3,514 new businesses opened in Q3 2021, a 32% increase year-over-year.
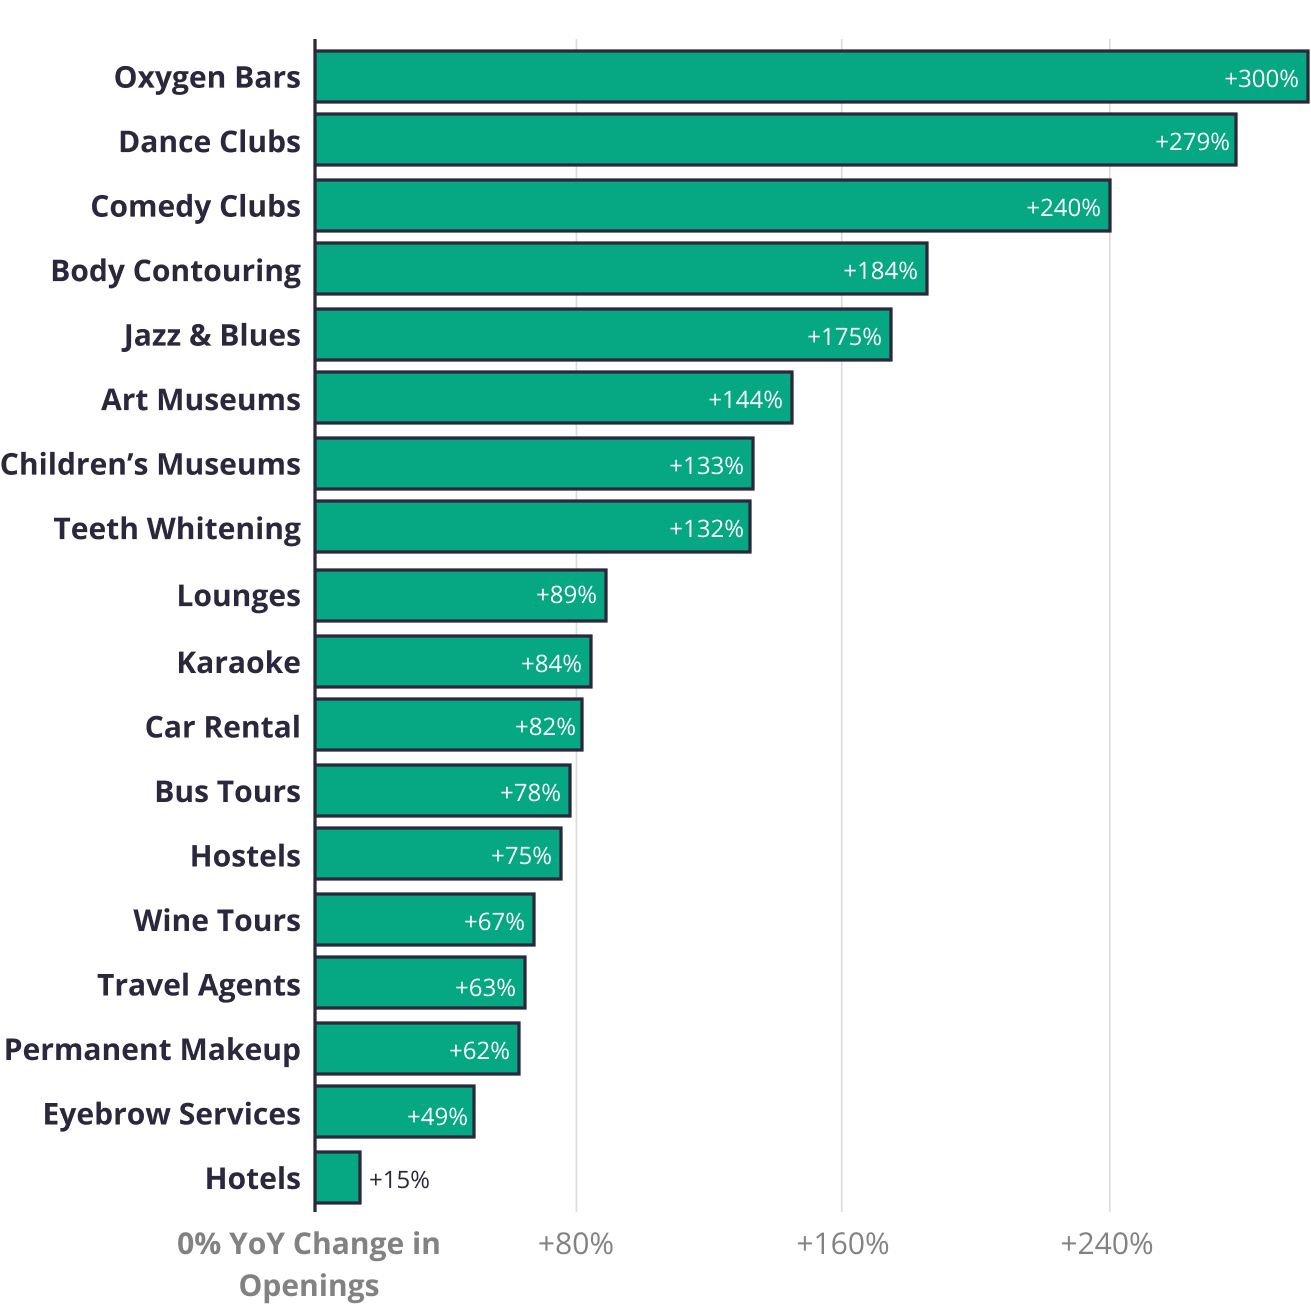
Nightlife saw 2,570 new business openings in Q3 2021, up 30% from Q3 2020. In Q3 2021, dance clubs (53 new business openings, up 279%) comedy clubs (34, up 240%) and lounges (213, up 88%) were all above Q3 2020 levels.
Beauty added 11,029 new businesses in Q3 2021, a 7% increase from Q3 2020. Teeth whitening (295, up 132% ) body contouring (654, up 184%), eyebrow services (796, up 49%) and permanent makeup (729, up 62%) all trended above Q3 2020 levels.
New Business Openings in Leisure, Beauty, and Hospitality Categories Spiked in Q3
Change in business openings on Yelp for select categories, Q3 2021 vs. Q3 2020


Overall, total new business openings across categories remained relatively flat in Q3 2021 reaching 142,328 openings, up 1% compared to Q3 2020. However, the total number of new businesses opened in the first nine months of 2021 (439,094) is above pre-pandemic levels for the same period in 2019 (433,243).
More Than 140K New Businesses Opened in Q3 2021
Business openings by month on Yelp, January 2018 – September 2021
New Restaurant and Food Business Openings Remain Steady Nationally and Increase in Some States Year-Over-Year
An industry-wide labor shortage, growing concern around the delta variant and rising food prices are some of the major barriers to the continued rebound of restaurant and food businesses. That said, the industry continues to show how well it has adapted since the pandemic began – from adopting new technology to manage front-of-house operations, to completely rethinking operating models.
New restaurant and food business openings remained steady with 19,892 new openings in Q3 2021, a 2% increase year-over-year. Food courts (64 new business openings, up 166%), buffets (54, up 200%) and soul food (208, up 46%) all increased above 2020 levels.
Several states also saw an increase from Q3 2020 to Q3 2021 in openings of restaurant and food businesses including New York (up 8%), Montana (up 6%), Rhode Island (up 12%), Maine (up 23%), Connecticut (up 20%), Hawaii (up 57%), Alaska (up 79%), and Wyoming (up 32%).
New Business Openings Slightly Increased, Fueled by Leisure, Beauty, and Hospitality Categories
Change in New Business Openings, Q3 2021 vs. Q3 2020
-40%
+40%
Consumers Return To Activities Related To Nightlife, Fitness and Entertainment
Yelp data highlights an increase in consumer interest in Q3 within several categories for both indoor and outdoor activities – from entertainment to fitness. These increases come at a time when most of the country was experiencing warm weather, and as more Americans were getting vaccinated. Consumer interest – measured by counting a few of the many actions people take to connect with businesses on Yelp: viewing business pages, or posting photos or reviews – demonstrates how people are engaging with local businesses, in turn providing insight into the local economic recovery.
In Q3 2021, consumer interest on Yelp increased above Q3 2020 levels for bowling (up 116%), waterparks (up 115%), Axe throwing (up 107%), stadium arenas (up 96%), indoor play centers (up 204%), lasertag (up 77%), and amusement parks (up 70%). This increase illustrates less hesitancy among consumers to participate in activities where the ability to social distance is limited or not possible.
After a year of home and outdoor workouts growing in popularity, gym and fitness classes are back on the rise. In Q3 2021, pilates (up 54%), pole dancing classes (up 56%), aerial fitness (up 74%), yoga (up 41%), barre classes (up 42%), and saunas (up 55%) all surpassed Q3 2020 consumer interest levels.
Many people also began to return to live entertainment, including the reopening of Broadway in New York City. Consumer interest increased for dinner theater (up 88%) eatertainment (up 201%), music venues (up 30%), and theater (up 46%), year-over-year.
In stark contrast to Q3 2020 when clubs and bars in many states remained closed due to local pandemic restrictions, Q3 2021 has seen consumer interest rise in both categories. In Q3 2021, dance clubs (up 67%), piano bars (up 58%), comedy clubs (up 79%), speakeasies (up 80%), and gay bars (up 38%) all increased in consumer interest when compared to the same period in 2020.
Consumer Interest in Nightlife, Fitness, and Entertainment Categories Has Rebounded Since 2020
Change in consumer interest, 2021 vs 2019, and 2021 vs 2020
Change since 2019
Change since 2020
Nearly 19-months into the pandemic and one thing has remained unchanged – local businesses are dedicated to serving their communities. Across the US, businesses of all sizes continue to adapt and persevere throughout the continuously evolving circumstances of the pandemic. As the new normal for consumers and businesses evolves we will continue to analyze and report on the trends driving economic activity for local businesses.
— Jessica Mouras, Will Langston, and Jenny Kao contributed to this report.
If you'd like additional detail on how the economy is shifting, please contact us at press@yelp.com or join our mailing list to receive an email when new reports are released.
Interested in learning how Yelp data can assist you in developing market insights for your business? Yelp Knowledge can help, learn more here.
Methodology
New Business Openings
Openings are determined by counting new businesses listed on Yelp, which are added by either business representatives or Yelp users. Openings are adjusted year-over-year, meaning openings are measured relative to the same time period in the previous period for the same business categories and geographic locations. This adjustment corrects for both seasonality and any differences in the baseline level of Yelp coverage in any given category and geography.
Business Reopenings as a Percentage (%) of Temporary Closures
To measure the percentage of businesses that have reopened after a temporary closure, we count U.S. businesses that were identified as temporarily closed and then reopened between March 1, 2020 and September 30, 2021. The timing of temporary closures and reopenings are based on when these events were reported to Yelp by consumers or businesses, as such the data may reflect delays depending on when Yelp received that information.
Reopenings include the termination of temporary closures as set by a business through Yelp’s temporary closure feature, or by the editing of business hours (excluding holiday closures). These changes to business pages are also vetted by Yelp’s moderators. Each reopened business is counted only once, on the date of its most recent reopening during the applicable time period.
Temporary closures are signaled by a business owner marking the business as temporarily closed, including by changing its hours or through a COVID-19 banner on its Yelp page. One-day closures that appear to be unrelated to the pandemic are not counted. Each temporarily closed business is counted only once, on the date of its most recent temporary closure. Temporary closures are a likely measure of businesses that were most impacted by the pandemic, however, many other businesses were also likely affected but remained open with curtailed hours and staffing, or did not update their Yelp business pages to reflect closures.
Business Reopenings
On each date, starting with March 1 2020, we count U.S. businesses that were temporarily closed and reopened through September 30, 2021. A reopening is of a temporary closure, whether by using Yelp’s temporary closure feature or by editing hours, excluding closures due to holidays and single day or less closures that appear unrelated to the pandemic. Each reopened business is counted at most once, on the date of its most recent reopening.
Consumer Interest
We measure consumer interest by looking at select actions users take to connect with businesses on Yelp: such as viewing business pages, or posting photos or reviews.
Changes in consumer interest for each category were measured by comparing year-over-year data from Q3 2021 and Q3 2020, focusing on each category’s share of all consumer actions in its root category.
Downloadable static graphics can be found here.
See Yelp's previous Coronavirus Economic Impact Reports at our Data Science Medium, Locally Optimal.


