Q1 2022
New Business Openings Signal Strong Economic Recovery While Consumer Behavior Highlights Rising Inflation in Q1, According to the Yelp Economic Average
For more on the methodology for this report, click here.
Several key economic indicators signal the U.S. economy has significantly recovered from pandemic lows and will continue to improve. However, obstacles including rising food and gas prices are creating some headwind for the recovery. This is especially true for small and local business owners who have been forced to get creative in the face of increased operating costs.
In the first quarter of 2022, Yelp data reveals that consumers are experiencing inflation at record levels, yet are increasingly looking for higher priced restaurants, all while mentions of EV charging stations are growing as gas prices rise. Business growth is rebounding, as new business openings in the U.S. grow above pre-pandemic levels and increase in the vast majority of states. Consumers are also returning to the types of businesses hit hardest by the pandemic, including nightlife and travel, while flexible work arrangements are fueling interest in coworking spaces.
Concerns About Inflation Reach New Record High on Yelp in Q1, yet Consumers Continued to Search for Higher Priced Restaurants
We previously reported that in the final quarter of 2021 the inflation sentiment on Yelp had reached a record high. By analyzing review text for specific mentions of various terms related to inflationary experiences, such as “higher prices,” “used to be cheaper,” and “more expensive,” versus disinflationary experiences such as “consistent value,” “stable prices,” and “reasonably priced,” we are able to see how consumers’ sentiment has changed since 2015.
As the U.S. government reported, the inflation rate continued to rise to record highs in Q1. Similarly, this trend continues to be reflected in review sentiment on Yelp. According to Yelp data, reviewers reporting increasing prices at local businesses grew rapidly in 2021 and reached a new peak in Q1 of 2022, rising by 3% from last quarter (Q4 2021), and 29% from Q1 of 2021.
Inflation Sentiment on Yelp Reaches a Record High in Q1
Mentions of inflationary vs. disinflationary terms in Yelp reviews since 2015
While consumer spending began to slow in Q1, Yelp data shows consumers still searched for higher-priced restaurants. Nearly half (43%) of all restaurant searches using the dollar filter on Yelp in Q1 were looking for higher-priced restaurants with the “$$$” and “$$$$” designation. While searches for low price point restaurants ($) decreased by 13% in Q1 2022 (compared to Q1 2019).
Consumers Continue to Seek Out Higher Priced Restaurants
Percent of Searches for Businesses Marked As
$
$$
$$$
$$$$
Consumers Turn To EV Charging Stations as Gas Prices Surge in Q1
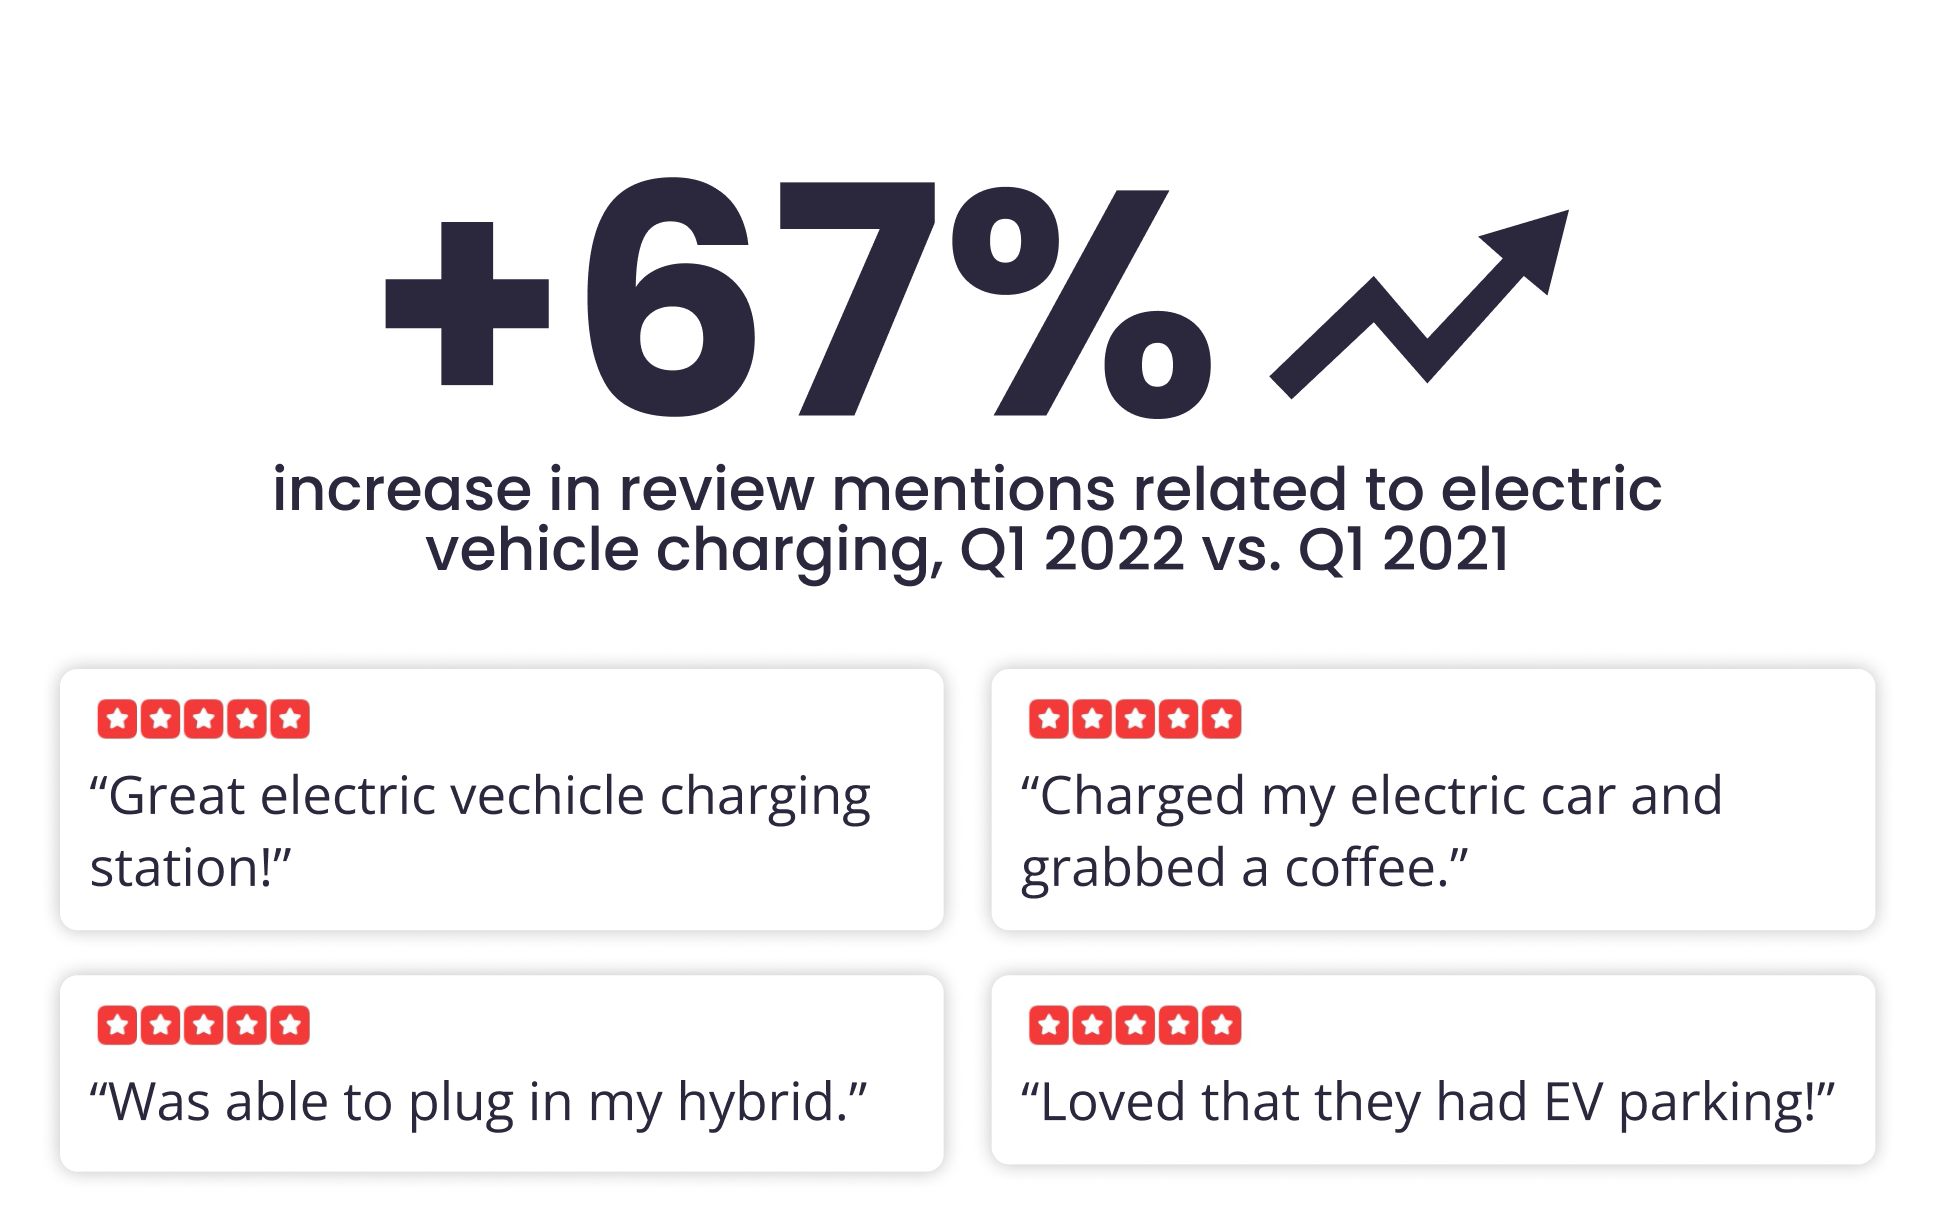
Over the last year gas prices have risen to record highs in the U.S. and are contributing to a surge in demand for electric vehicles. By analyzing Yelp review text mentions related to electric vehicles Yelp data shows a national increase of 67% in mentions related to electric vehicle charging in Q1 2022 compared to the same period in 2021. For some states this increase grows when they are examined individually, most notably a 352% increase in Maryland and a 107% increase in New York. EV Charging stations also experienced a 27% increase in openings in Q1 2022 compared to Q1 2021. To support this consumer demand, Yelp recently launched new searchable eco-friendly business attributes, including "EV charging stations available."
Consumer Mentions of EV and Hybrid Vehicles Grew As Gas Prices Soared in Q1


U.S. Business Openings Surpassed Pre-Pandemic Levels in Q1
Businesses in the U.S. are continuing to rise from pandemic-related hardships with the unemployment rate falling to a new pandemic low in March. Yelp data also points to continued momentum in the economic recovery with new business openings in Q1 exceeding pre-pandemic levels. In Q1 2022, business openings increased by 5% to 152,859 from 145,189 in Q1 2021.
More Than 150K New Businesses Opened in Q1 2022
Business openings by month on Yelp, January 2019 – March 2022
Hotels and travel (3,637) nightlife (2,346) and beauty (12,744) categories on Yelp had the largest percentage increases, rising 31%, 23%, and 22% respectively in Q1 year-over-year. Restaurant and food new business openings fell slightly to 17,690, a 2% decrease from Q1 2021 (18,090), but still 5% above Q1 2020 (pre-pandemic) with 17,301 openings.
Hotels & Travel, Nightlife, and Beauty Business Openings Significantly Rebounded in Q1
Business openings by month on Yelp, January 2019 – March 2022
2019
2020
2021
2022
New Business Openings Rise in Vast Majority of States; Nightlife Boomed in Many Major Cities
Americans are continuing to start new businesses – according to The Economic Innovation Group, the U.S. now has more businesses with physical locations than it did pre-pandemic. Yelp data shows 33 states experienced an increase in new business openings with Washington (39% increase), Hawaii (17%), Montana (14%) and California (13%) showing the largest percentage increases year-over-year in Q1.
States across the country including California, New York and Illinois lifted mask mandates and eased or completely eliminated vaccination requirements for indoor activities in Q1. During that time Yelp data showed a spike in nightlife business openings across many major cities. In several of those cities nightlife accounted for the largest percentage increase in new business openings in: Milwaukee, WI (140% increase in nightlife business openings); Knoxville, TN (133%); Raleigh, NC (129%); Los Angeles, CA (102% ); Philadelphia, PA (94%); New York, NY (85%); Washington D.C. (79%); Chicago, IL (65%); Honolulu, HI (40%), and Cincinnati, OH (36%).
New Business Openings Increased in Most States, Fueled by Nightlife and Travel Categories
Change in New Business Openings, Q1 2022 vs. Q1 2021
-40%
+40%
Return to Work Fuels Demand for Coworking Spaces and Pet Boarding
For employees with flexibility in where they work coworking spaces are a popular alternative to traditional office life. Consumer interest in shared office spaces increased 46% in Q1 2022 compared to the same period in 2021.
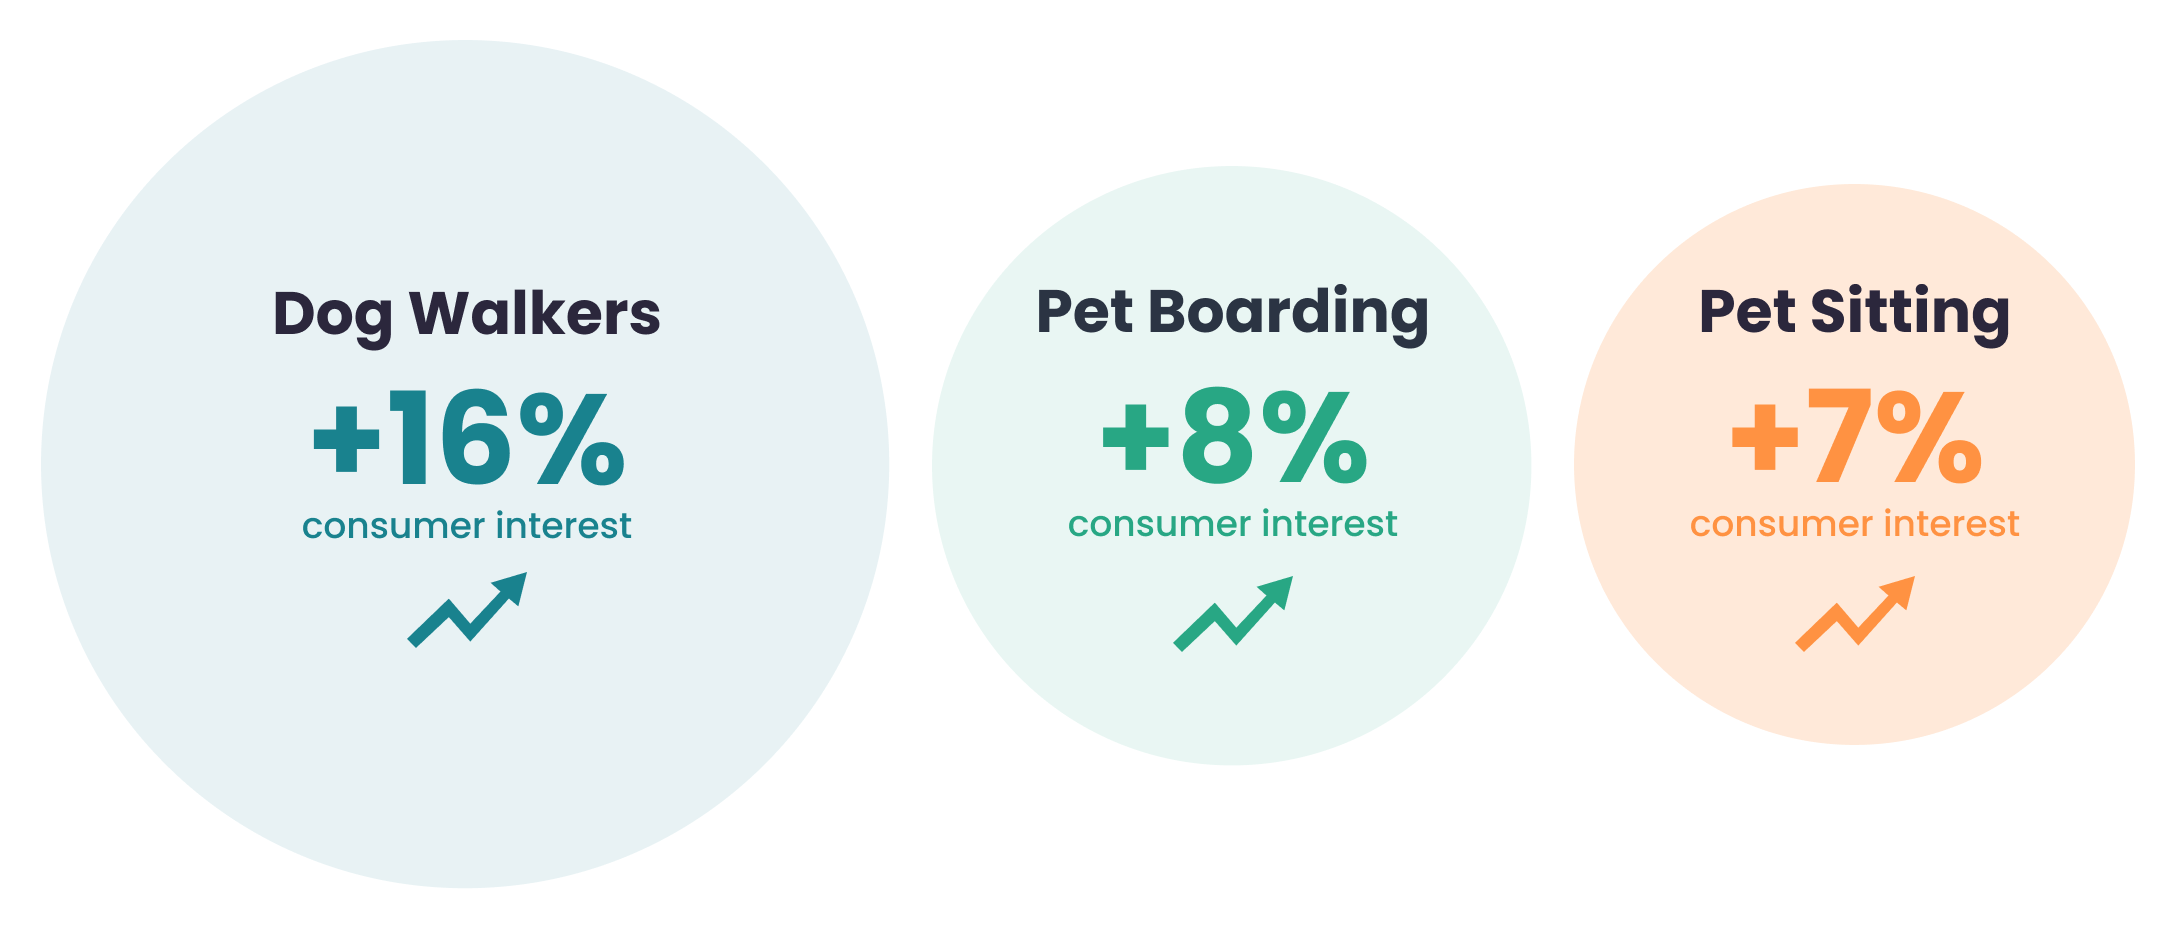
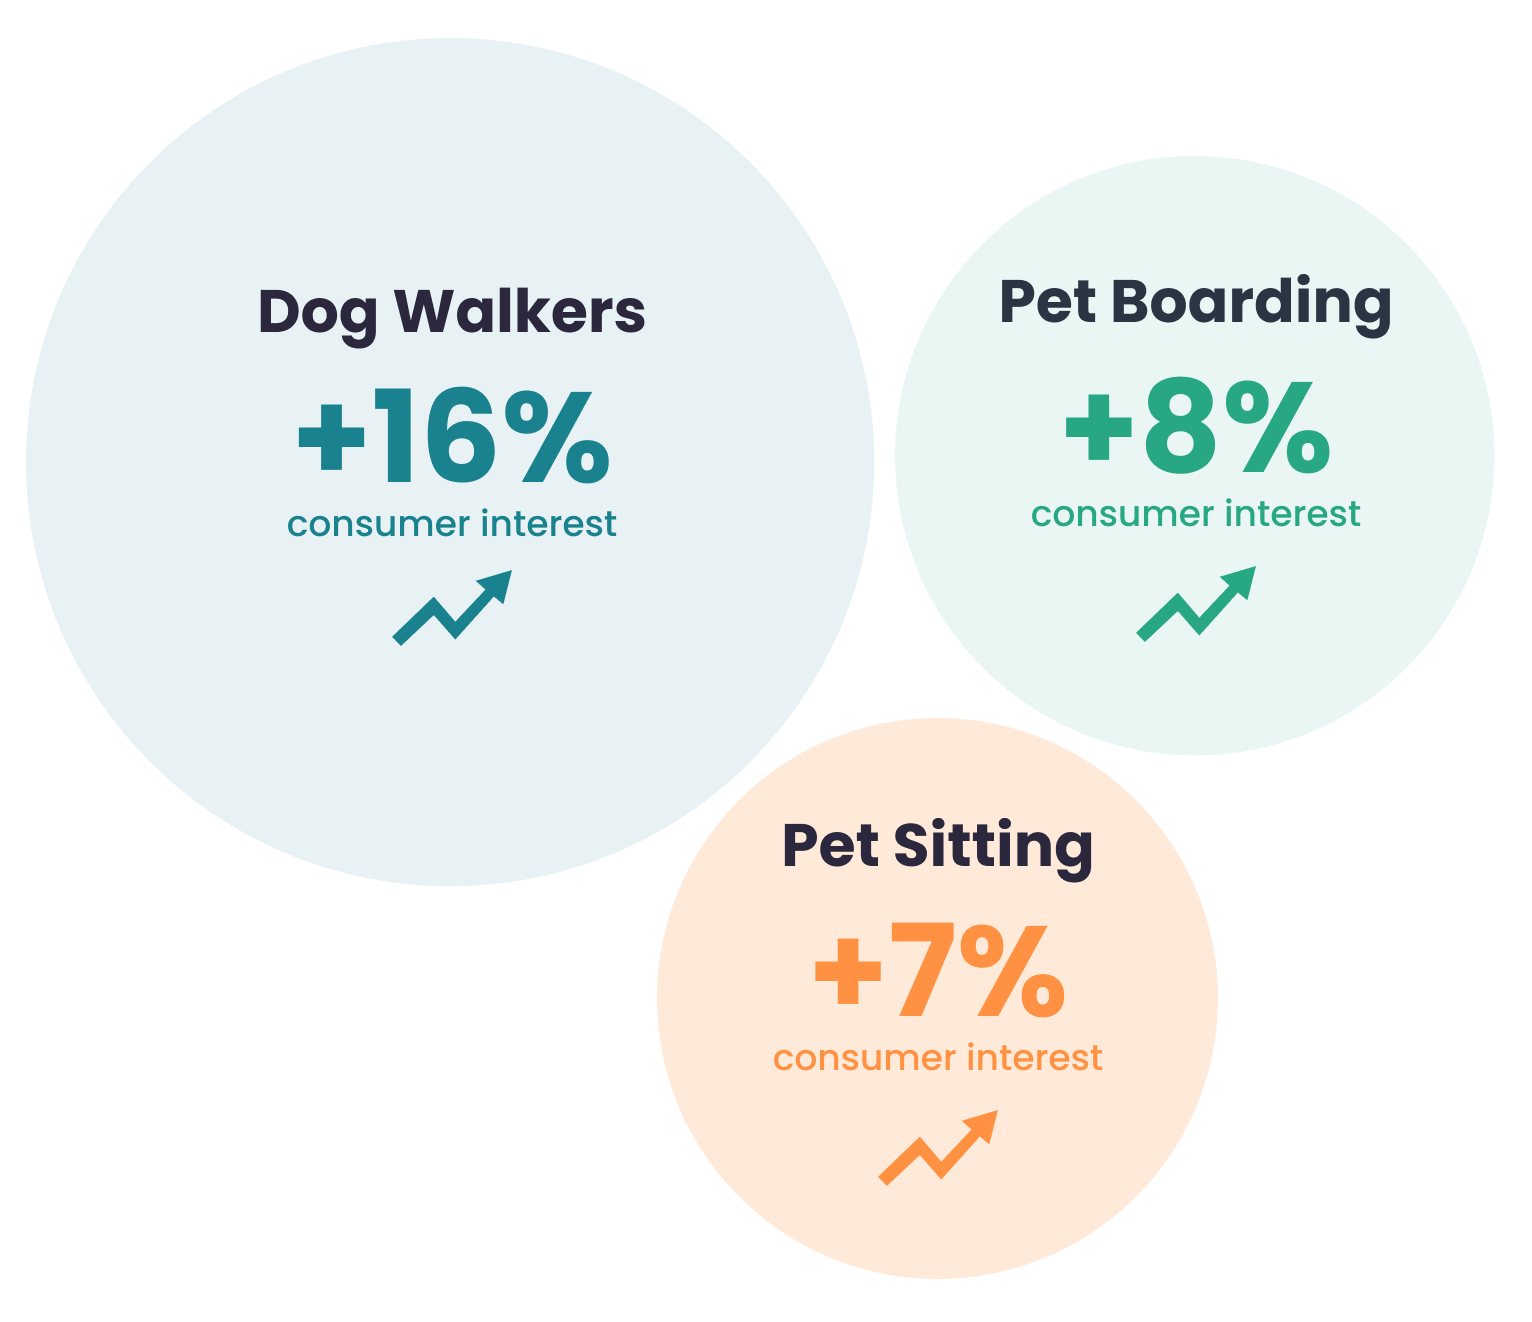
As companies continued to reopen offices in Q1, many people have had to find a caretaker for their pet for the first time since the pandemic began. Yelp data shows consumer interest increases in Q1 for dog walkers (16% increase), pet sitting (7%) and pet boarding (8%) are all above 2021 levels. Pet businesses are also growing across the country. New business openings for pet training, pet groomers and pet stores have increased nationally – 15%, 12%, and 20% respectively in the first quarter of 2022 compared to 2021.
Pet Care Businesses Have Seen a Jump in Interest as Consumers Return to the Office
Change in consumer interest for select categories on Yelp, Q1 2022 vs. Q1 2021


Overall, the economy remains strong despite growing fears of a recession and challenges presented by supply chain and labor shortage issues. Business owners, especially small and medium-sized local businesses, will need to continue successfully adapting as the road to recovery is paved with twists and turns. We will continue to highlight how local businesses are navigating those changes in our economic insight reports.
— Jessica Mouras, Will Langston, and Jenny Kao contributed to this report.
If you'd like additional detail on how the economy is shifting, please contact us at press@yelp.com or join our mailing list to receive an email when new reports are released.
Interested in learning how Yelp data can assist you in developing market insights for your business? Yelp Knowledge can help, learn more here.
Methodology
Price Range Filter Usage
There are currently 4 pricing tiers ($, $$, $$$, and $$$$) on Yelp and the pricing tier of a business is voted on by Yelp users. Consumers can use the price range filter when searching for businesses on Yelp. The share of different pricing tiers used by consumers signals their general willingness to spend.
Review Text Inflation / Disinflation Sentiment Ratio
To observe the sentiment of Yelp consumers over time, we analyzed review text from 2015 through Q1 2022. Yelp examined consumers’ experience of inflationary situations, such as rising prices for goods and services and compared that experience to the inverse scenario of disinflation, which includes sentiments indicating stable prices and consistent values. The volume of review text phrases indicating these are normalized by the number of times per million the phrases appeared in reviews and are then used to calculate a ratio of inflationary vs disinflationary experiences. This ratio was calculated quarterly and deseasonalized via the index method using the previous 5 years (2015 - 2019). A ratio above 1.0 indicates overall consumer sentiment of inflation and below 1.0 indicates disinflation sentiment. This was calculated on a national basis across all major Yelp categories. Changes in the ratio are quarter-over-quarter percent changes.
New Business Openings
Openings are determined by counting new businesses listed on Yelp, which are added by either business representatives or Yelp users. Openings are adjusted year-over-year, meaning openings are measured relative to the same time period in the previous period for the same business categories and geographic locations. This adjustment corrects for both seasonality and any differences in the baseline level of Yelp coverage in any given category and geography.
Consumer Interest
We measure consumer interest by looking at select actions users take to connect with businesses on Yelp: such as viewing business pages, or posting photos or reviews.
Changes in consumer interest for each category were measured by comparing year-over-year data from Q1 2021 and Q1 2022, focusing on each category’s share of all consumer actions in its root category.
Electric / Hybrid Review Text Mentions
For the data regarding “electric and hybrid transportation”, we measured the share of total words in U.S. auto services reviews containing phrases related to sustainability, including but not limited to: “electric,“ “hybrid,” “plug in hybrid,” and “EV.”
Downloadable static graphics can be found here.
See Yelp's previous Coronavirus Economic Impact Reports at our Data Science Medium, Locally Optimal.


