Q2 2022
Q2 Yelp Economic Average Finds Consumers are Experiencing Inflation at Record Rates, Reporting New Experiences of Shrinkflation and Waiting Longer Than Ever for Reservations
Amid inflation and rising gas prices, in Q2 consumers seek fewer higher-priced businesses and turn to electric vehicles
For more on the methodology for this report, click here.
If the last few years have demonstrated anything it’s the resilience of local businesses, people and communities in the U.S. and across the world. When given the opportunity communities have come together to support and uplift one another under challenging circumstances. However, the challenges facing local economies have been relentless – from an ever-changing pandemic with new variants regularly emerging, staffing shortages, supply chain issues, social justice and human rights inequalities, rapidly increasing inflation and rising interest rates, to name a few.
To provide insight on the impact of these shifting circumstances on local economies, Yelp has regularly reported on how businesses operate and how consumers are reacting. In Q2 2022, Yelp data shows consumers are experiencing inflation at record rates, with some states experiencing inflation more than others, and for the first time consumers are reporting experiences of shrinkflation in their reviews, as well as increasingly seeking electric vehicles in response to rising gas prices. Yelp data also found that while fewer consumers sought out higher-priced businesses than earlier in 2022, they’re still looking for high-priced businesses more than pre-pandemic. In the first half of 2022 they’re also waiting longer than ever to get a reservation at restaurants.
Consumers Report Inflationary Experiences at Record Rates
The annual inflation rate in the U.S. quickly increased above market forecasts to 9.1% in June of 2022, a 40-year high. To counter skyrocketing inflation rates, in June the Federal Reserve increased interest rates by three-quarters of a percentage point. While it’s expected the Fed will continue raising rates, Americans are already coping with increasing prices at restaurants, grocery stores, gas stations, retail stores, hotels and more. In fact, in Q2 2022 mentions of inflationary language in Yelp reviews have increased by 28% compared to the same time period in 2021 and 33% compared to Q2 2020 – with inflation mentions increasing faster than ever before. While inflation has been rapidly increasing since 2021, consumers have continued to experience inflation at an increasing rate in 2022 as mentions of inflationary language in Yelp reviews are up 7% in Q2 compared to Q1 of this year.
Mentions of Inflation Continue to Rise on Yelp
Mentions of inflationary language in Yelp reviews, Q2 2020 - Q2 2022
In Q2, consumers experienced inflation the most at more casual restaurants and food businesses, with inflation mentions in reviews up 38% and 36%, respectively, compared to Q2 2021. Notable category increases include chicken shops (up 82%), TexMex (up 68%), fruit and vegetable markets (up 66%), Caribbean restaurants (up 65%), poke (64%), soul food (up 57%), Hawaiian restaurants (up 57%) and convenience stores (up 55%). Consumers are also experiencing high inflation at arts and entertainment businesses (up 33%), particularly at festivals and street fairs (up 164%), stadiums and arenas (up 43%), arcades (31%) and movie theaters (31%). Nightlife businesses (up 30%), event services (up 22%), and hotels and travel businesses (up 20%) follow as the most inflationary categories based on Yelp reviews.
Inflationary Experiences Have Steadily Increased Across Categories for the Last Two Years
Mentions of inflationary language in Yelp reviews, Q2 2020 - Q2 2022
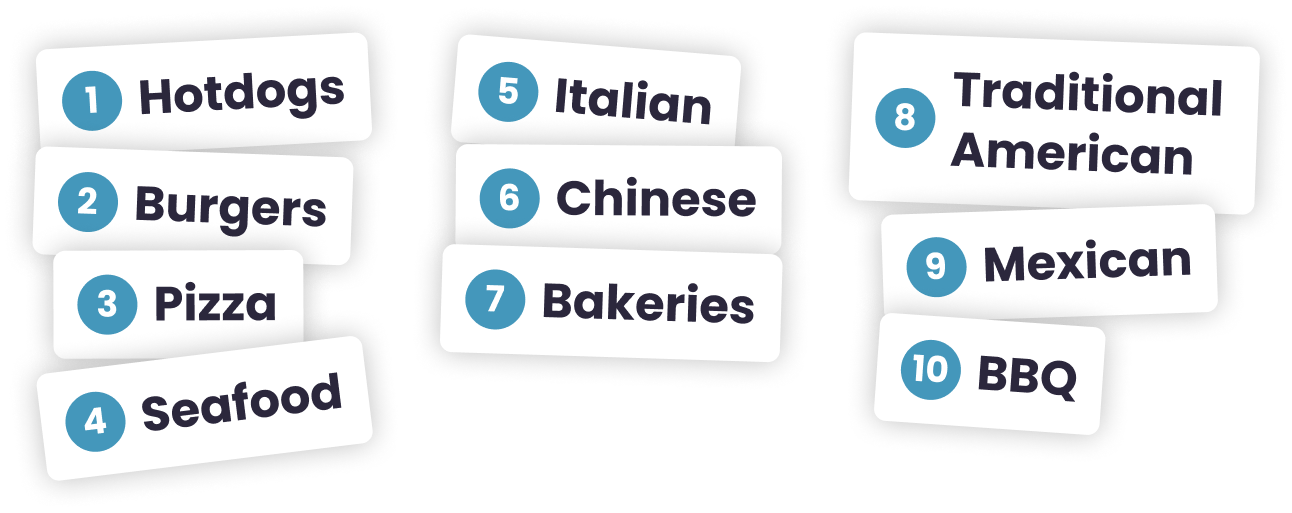
In addition to higher prices on grocery stores’ shelves and in restaurants, consumers are also seeing the size or quantity of their goods shrink – a phenomenon that’s also reflected in Yelp. For the first time ever consumers are mentioning “shrinkflation” in Yelp reviews. In Q2 2022, consumers are talking about shrinkflation-related experiences most commonly at restaurants serving more affordable offerings like hot dogs, hamburgers, pizza, followed by seafood restaurants, Italian food, and Chinese food.
Consumers Are Reporting Shrinkflation in Yelp Reviews for the First Time
The top ten food and restaurant categories with the most mentions of “shrinkflation” in reviews


Consumers in Some U.S. States are Expressing More Inflationary Experiences Than Others
While nearly everyone is feeling the effects of inflation, it’s not always felt equally across the U.S. In Q2 2022, 47 states (including Washington D.C.) saw an overall increase of inflation mentions in Yelp reviews compared to Q2 2021 – with 35 states seeing more than a 25% increase of inflation mentions. Six of the top 10 states with the highest inflation experiences are in the Northeast, including Massachusetts, New York, Maine, Washington D.C., New Jersey and New Hampshire. States with the highest year-over-year increase in inflation experiences are South Dakota, Montana, Idaho, Arkansas and Nevada.
Mentions of Inflation Have Increased in Nearly Every State
The states that saw the largest year-over-year increase in inflationary experiences at restaurants include South Dakota (up 170%), Kansas (111%), Arkansas (81%), Wisconsin (59%) and New Hampshire (56%) – driven by cafes, seafood restaurants, breakfast and brunch spots, and buffets. Whereas for hotels and travel, Washington D.C. (up 135%), New Mexico (up 66%), Colorado (up 50%), Virginia (up 46%), and Pennsylvania (up 38%), experienced the highest increase of people talking about inflation. Kansas (152%), Arkansas (128%) and Idaho (109%) experienced the most increased inflation mentions at bars and nightlife businesses, particularly at sports bars, cocktail bars, and dive bars.
Home, local, professional and auto services also drove significant inflationary experiences across the U.S. New Hampshire (up 259%), Massachusetts (up 47%), Idaho (up 47%), Wisconsin (up 44%) and Colorado (up 42%) saw the largest year-over-year increase in inflationary experiences for home services, mainly within flooring, landscaping, movers, and HVAC categories. Massachusetts (up 85%), Colorado (up 79%), Maryland (up 76%), North Carolina (up 66%) and Hawaii (up 64%) saw the largest increase in inflationary experiences for local services, largely within self storage, sewing and alterations, carpet cleaning, and junk removal. Nevada (up 114%), Florida (up 52%), and California (up 8%) saw the largest increase in inflationary experiences for professional services, driven by lawyers, wholesalers, and software developers. And Idaho (up 102%), South Carolina (up 54%), Hawaii (up 44%) and Illinois (up 44%) saw the largest increase in inflationary experiences for auto services, with consumers reporting increased inflationary experiences at auto repair businesses, gas stations, and car dealerships.
Consumers in Each State Are Experiencing Inflation Across Different Categories
Category with the highest change in mentions of inflationary language in Yelp reviews by state, Q2 2022 vs. Q2 2021
Consumer Searches for Higher Priced Businesses Fell, Yet Remain Above Pre-pandemic Levels
According to the Bureau of Economic Analysis consumer spending growth slowed in May 2022, which was also reflected on Yelp. In Q2 2022, the share of all searches on Yelp using the inexpensive “$” filter increased by 7% and the use of the moderately low “$$” filter increased by 5% compared to Q1 2022, while the share of the moderately high “$$$” filter decreased by 7% and the highest “$$$$” filter decreased by 12%.
That said, amid growing inflation, overall consumer spending continues to remain strong. While quarter-over-quarter consumers are generally searching for lower-priced businesses, when compared to pre-pandemic levels (Q2 2019), consumers still searched for higher-priced businesses more frequently in the second quarter of this year. Searches on Yelp using the highest “$$$$” filter increased by 55% and the use of the moderately high “$$$” filter was up by 40% in Q2 2022 compared to Q2 2019, whereas the use of the moderately low “$$” filter decreased by 5% and the inexpensive “$” filter decreased by 24%. While restaurants, food, and travel and hotel searches reflect a similar trend, auto services searches oppose the trend.
Consumers’ Growth in Seeking High Priced Businesses Slows
Consumers are Booking Reservations Further in Advance Than Ever Before
As consumers continue searching for higher-priced establishments and restaurants still find their way through a staffing shortage, getting a reservation has become harder than ever. In the first half of 2022, consumers waited longer for a reservation than they ever have in the past. In Q2, the average time elapsed between booking a reservation on Yelp and the reservation date was 3.3 days – a 14% increase in time compared to Q2 2021 and 40% more than pre-pandemic (Q2 2019). These reservations made further in advance are also reflective of consumers being more purposeful when they do go out. The largest increase in the average time between booking a restaurant reservation and the date of the reservation in Q2 compared to pre-pandemic isn’t in large metropolitan areas, but in up-and-coming and growing cities such as Birmingham, AL; Jacksonville, FL; Grand Rapids, MI; Lancaster, PA; High Point, NC; Austin, TX and Nashville, TN.
Booking reservations further in advance is not the only evidence of strong demand for restaurants amid continued staffing shortages. The median wait time for Yelp Waitlist restaurants has also been longer this year. The median wait time for a table in Q2 2022 was 35 minutes; whereas in the same period in 2021 and 2020, the median wait time was 22 and 16 minutes, respectively.
Consumers Are Experiencing Longer Wait Times and Are Booking Reservations Further Out in Advance
Consumers Turn to Electric Vehicles in Response to Raising Gas Prices
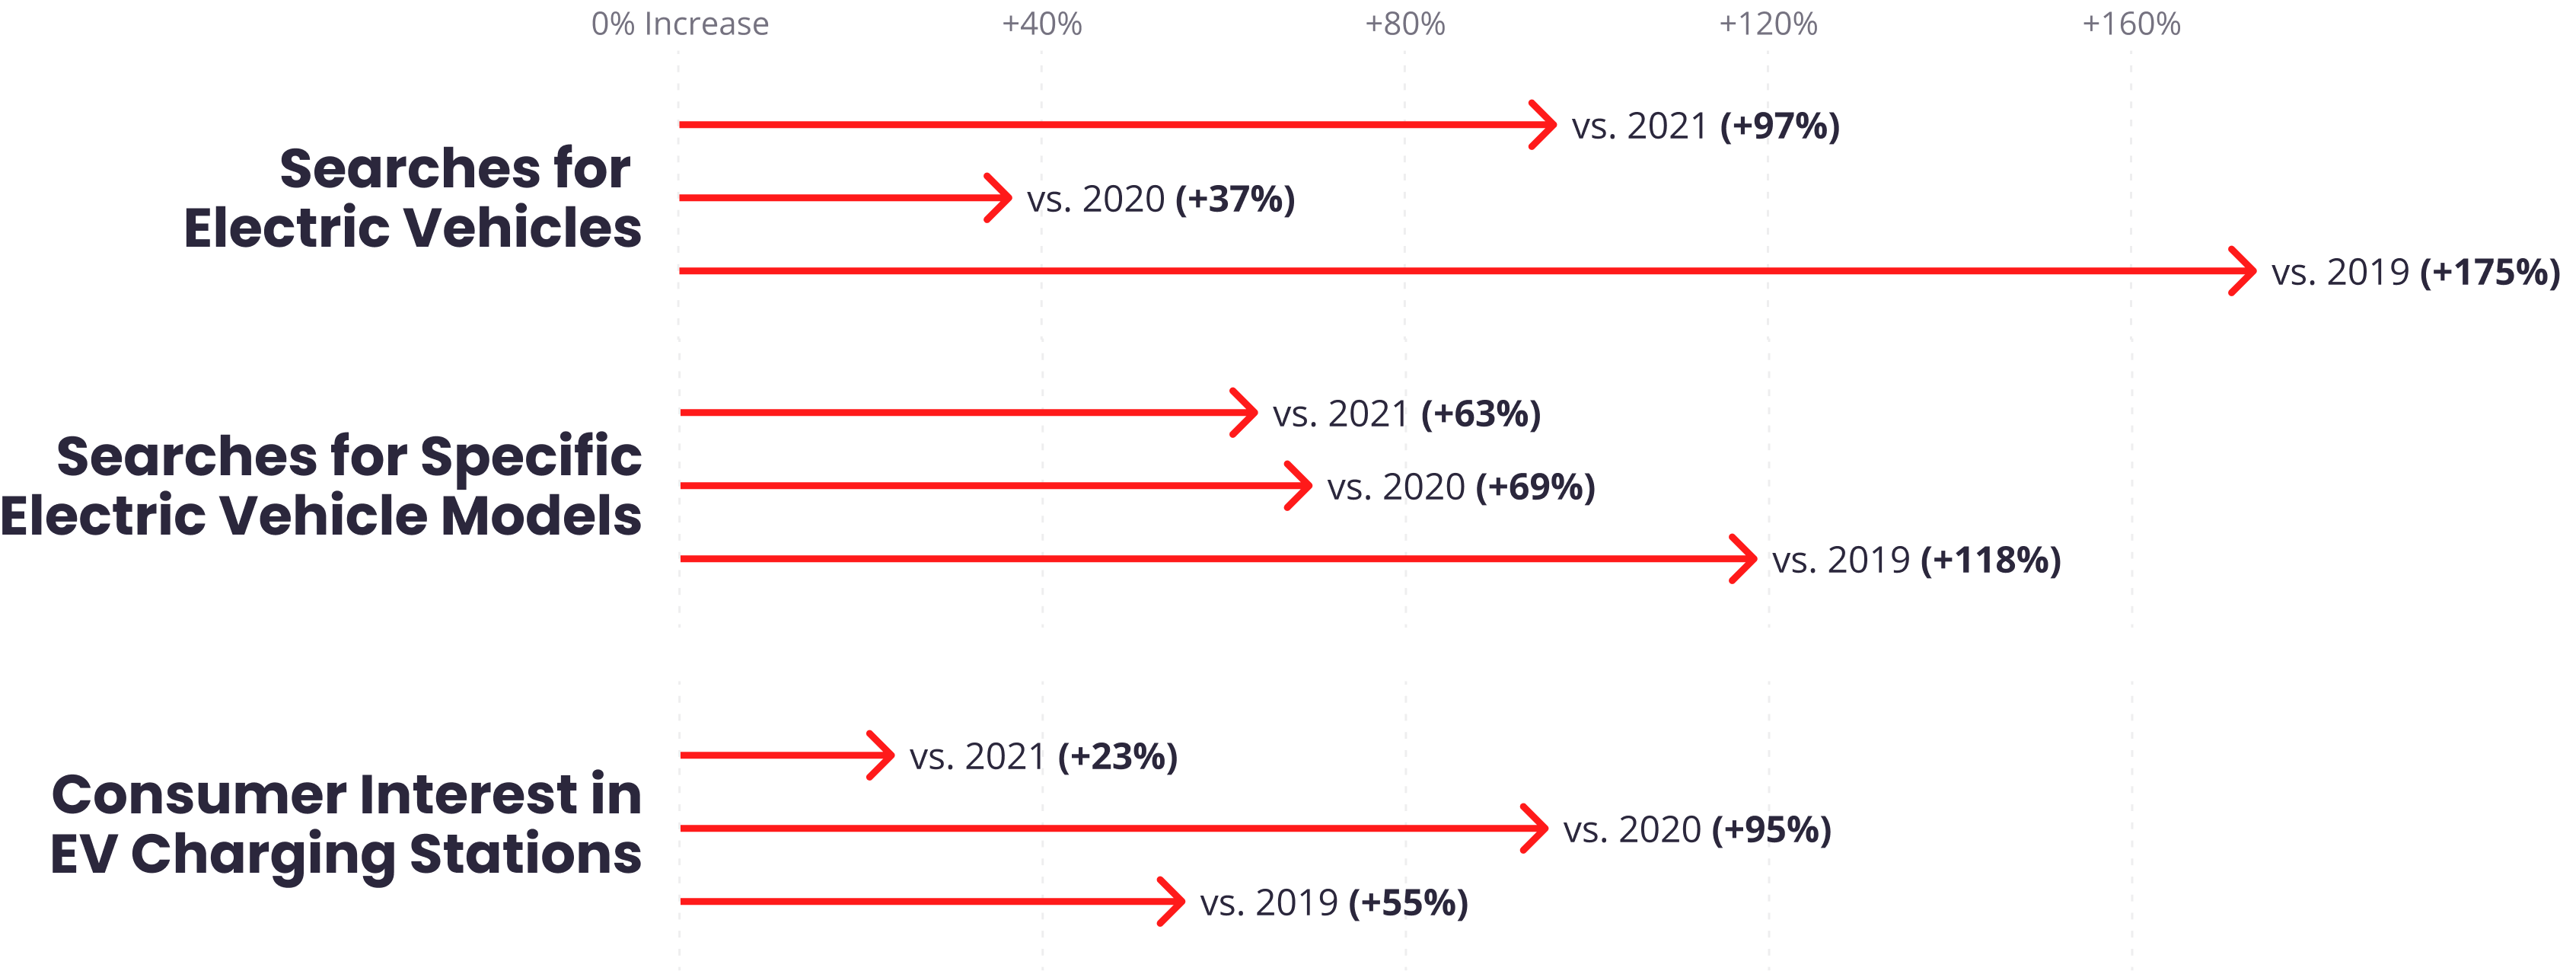
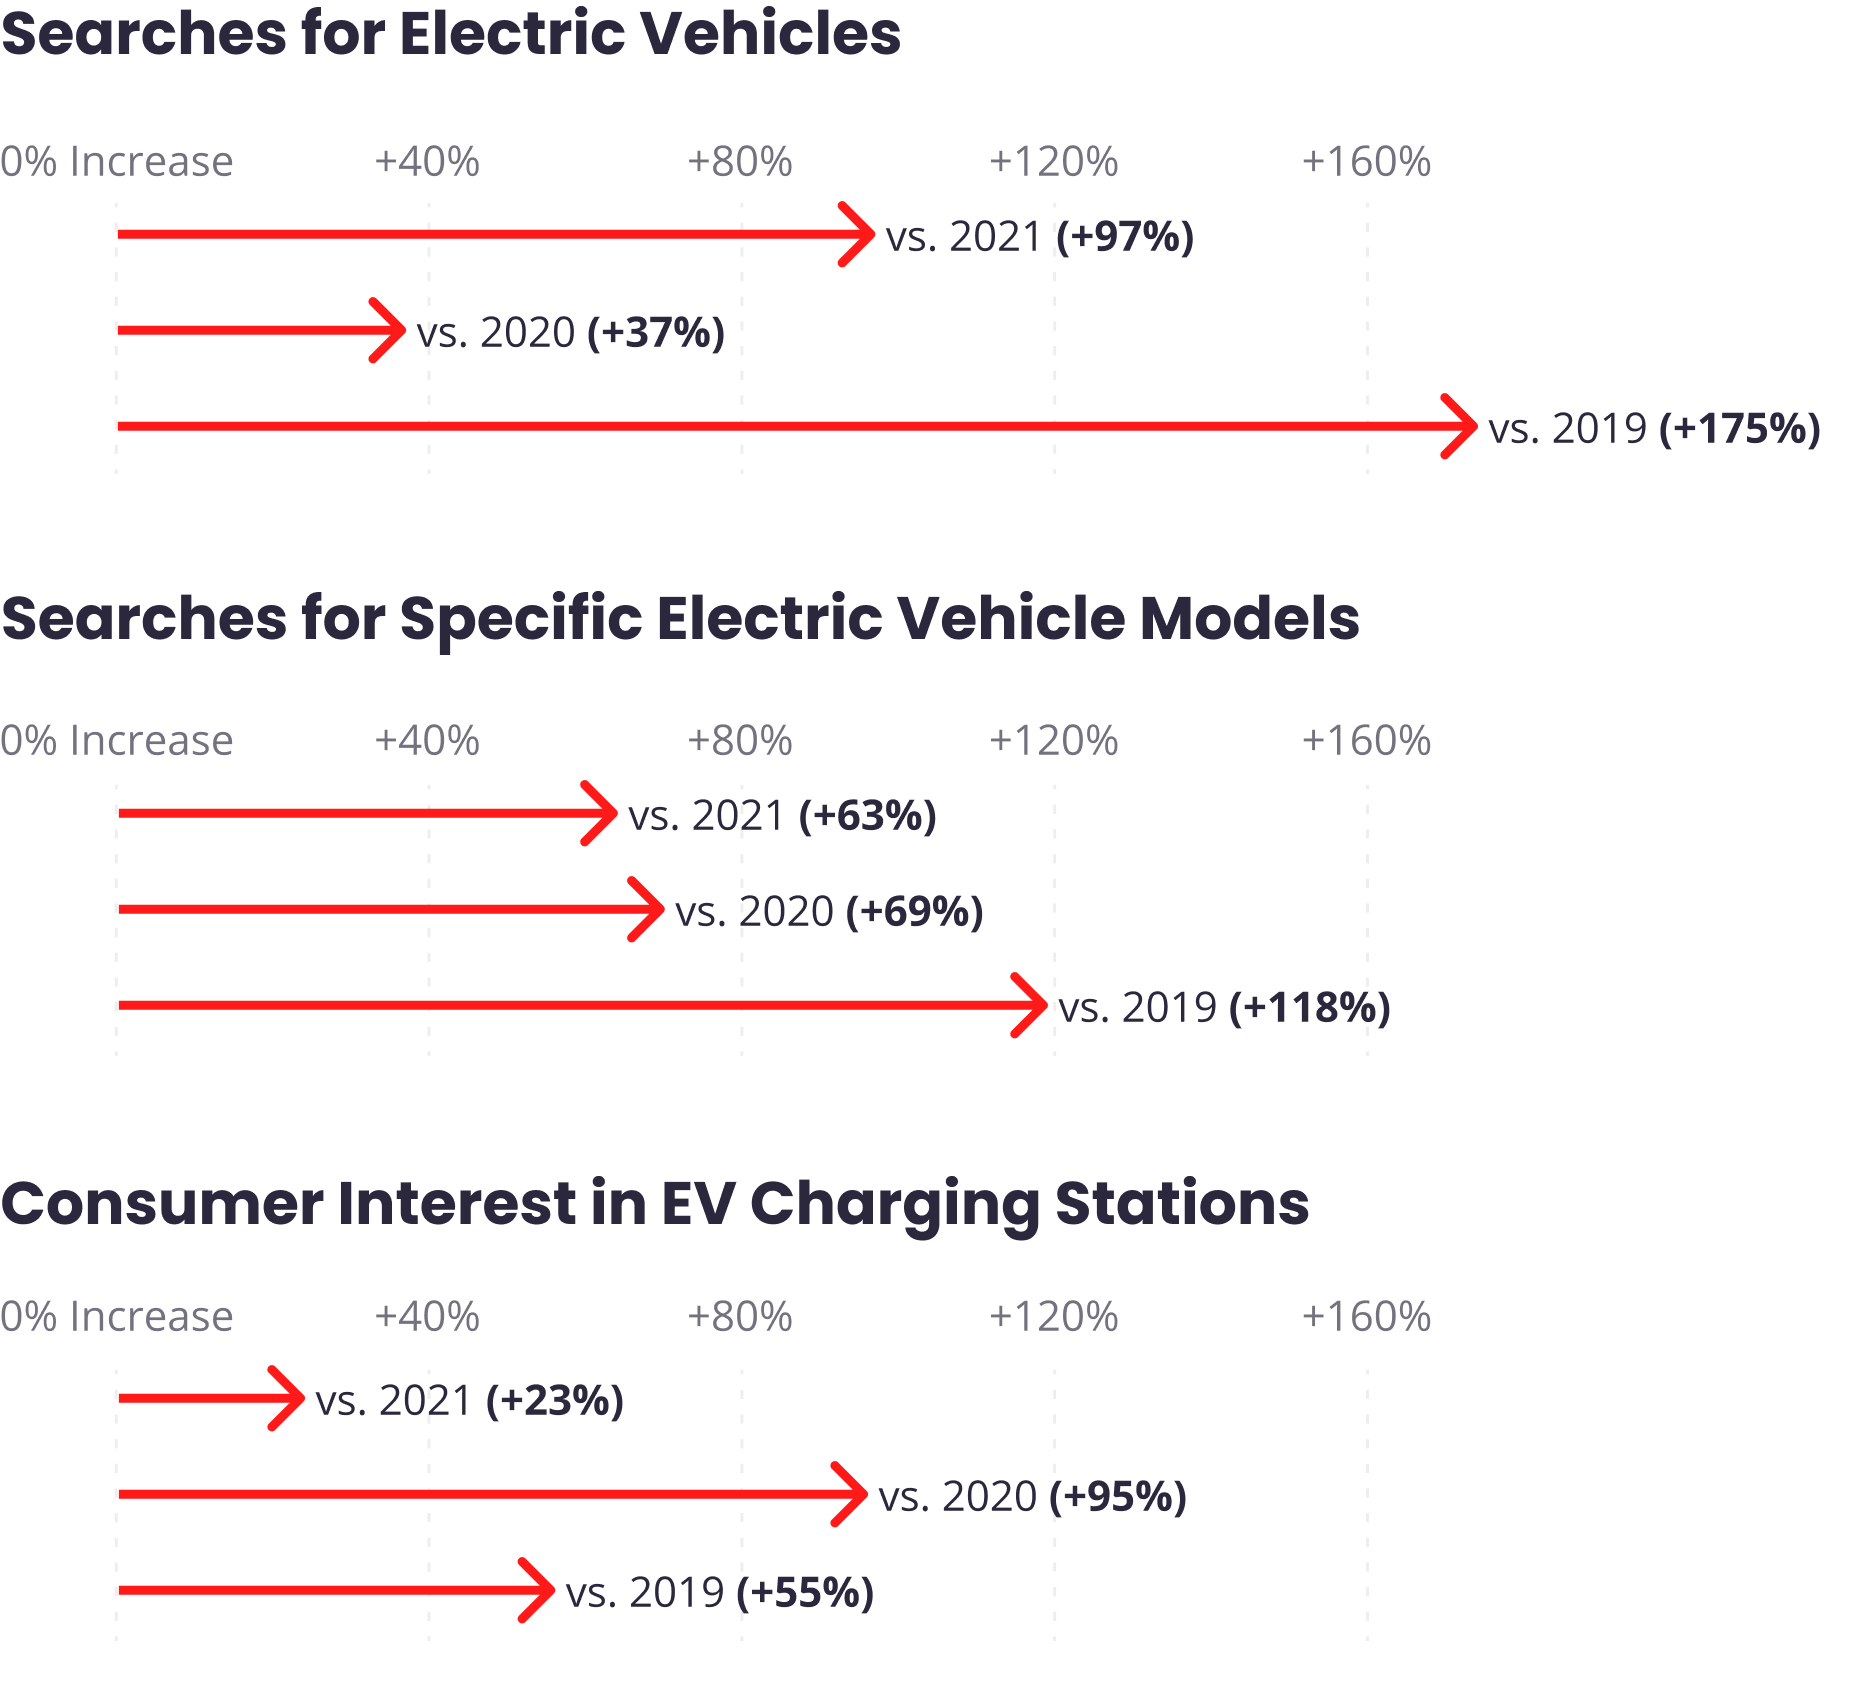
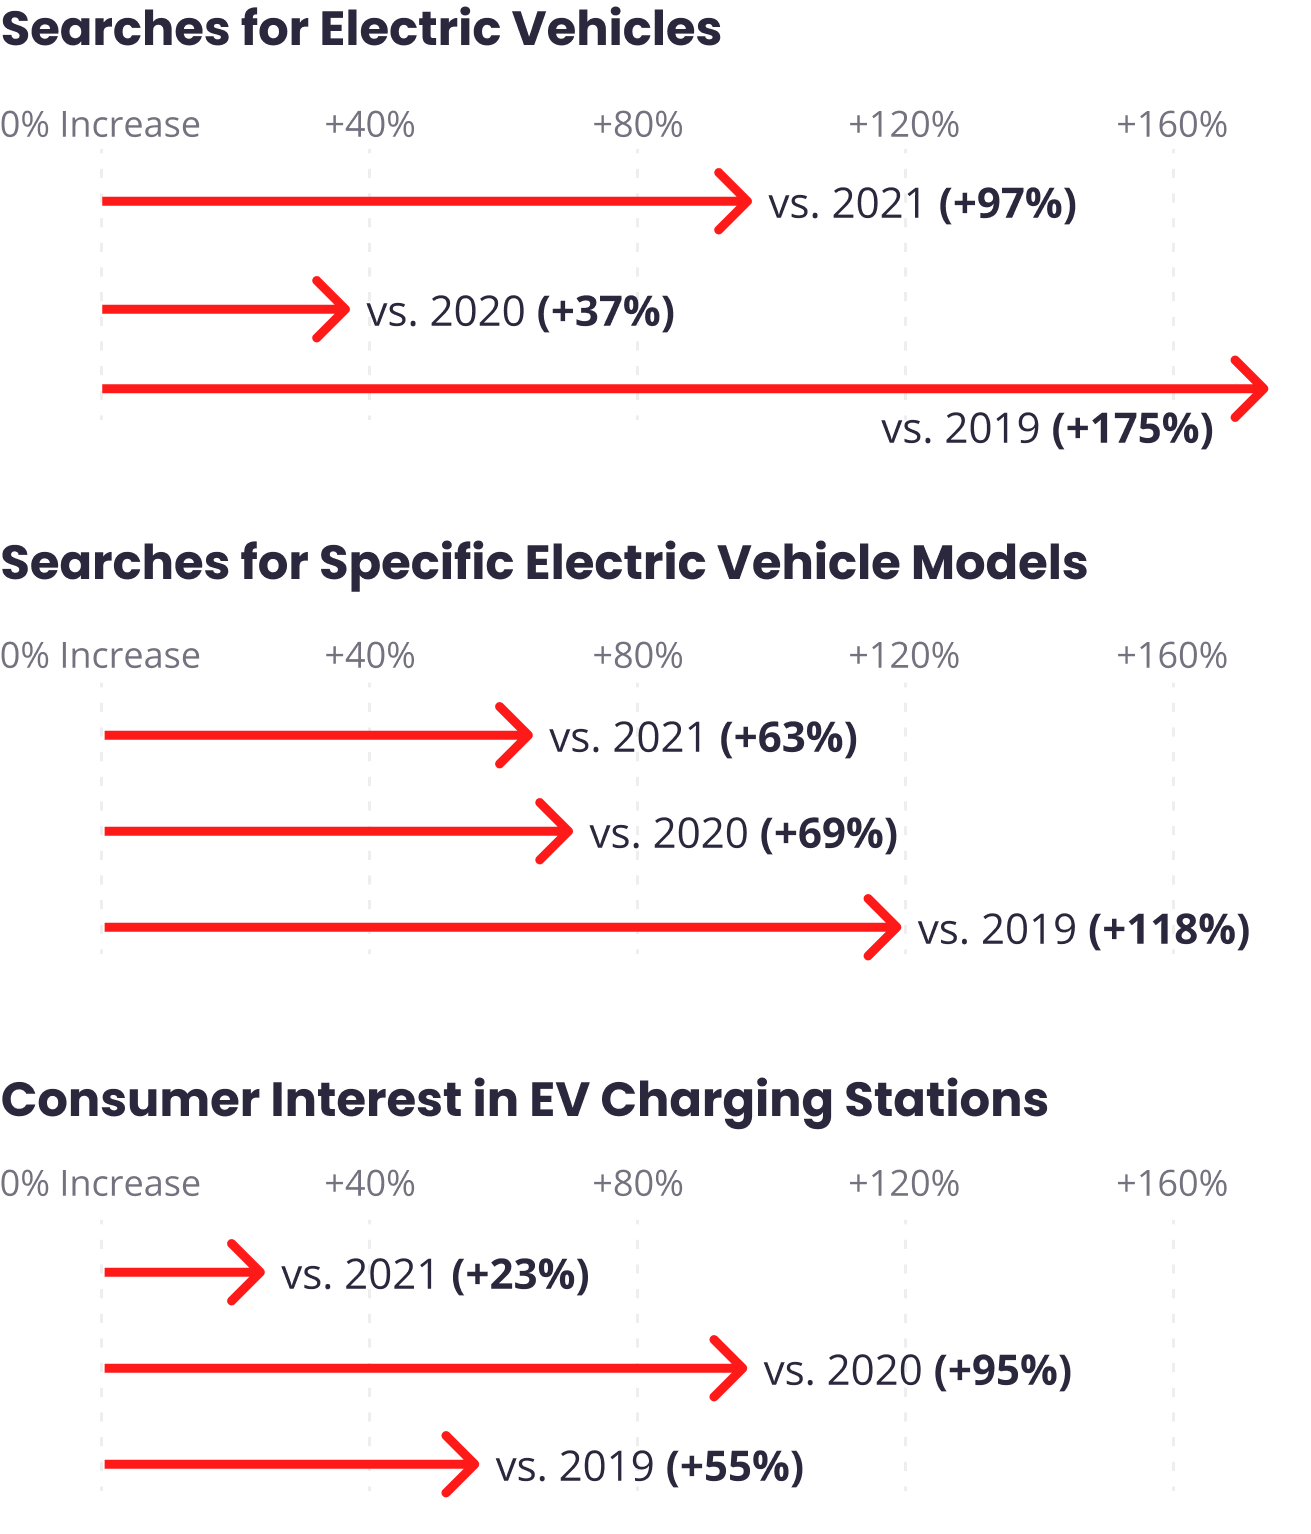
As gas prices rose to a national average of $5 a gallon in June, the highest national average ever recorded, many consumers explored more fuel-efficient driving options during the second quarter. Consumer searches for “electric vehicles'' were up 97% in Q2 2022 from the year before, and up 175% compared to pre-pandemic Q2 2019. Additionally, searches for specific electric vehicle (EV) models, from manufacturers such as Tesla, Chevrolet, and more, were up 63% in Q2 2022 compared to Q2 2021. Compared to pre-pandemic levels, the rise in consumer searches for EV models in Q2 2022 increased 118% from Q2 2019.
EV Charging stations also experienced a 23% increase in consumer interest in Q2 2022 compared to Q2 2021. To support this increasing demand, in April 2022 Yelp made it easier for consumers to search for EV charging stations on the Yelp platform. As of July 2022, more than 5,200 businesses have added this new attribute to their Yelp page.
Consumers Are Increasingly Turning to Electric Vehicles
Change in consumer searches and interest for electric vehicles and charging stations, Q2 2022 vs. previous years


As evident in Yelp’s economic reports, local businesses and consumers are continuing to persevere through the latest economic challenges. As these developments unfold, Yelp will continue to report on the changes local economies face through our ongoing economic reports.
— Will Langston and Jenny Kao contributed to this report.
If you'd like additional detail on how the economy is shifting, please contact us at press@yelp.com or join our mailing list to receive an email when new reports are released.
Interested in learning how Yelp data can assist you in developing market insights for your business? Yelp Knowledge can help, learn more here.
Methodology
Review Text Mentions of Inflation
We analyzed review text from 2020 through Q2 2022 to observe how Yelp consumers are referencing inflation in reviews. These inflation references can include phrases mentioning inflation itself or higher or rising prices at businesses. The volume of review text phrases are normalized by the number of times per every million words the phrases appeared in reviews, and is calculated for each Yelp category and on a national and state basis. Changes in mentions are on a year-over-year basis unless otherwise specified. A minimum threshold of review mentions was implemented in nearly all states to uncover the most noteworthy inflation experiences.
Price Range Filter Usage
There are currently four pricing tiers ($, $$, $$$ and $$$$) on Yelp and the pricing tier of a business is voted on by Yelp consumer users (business users cannot alter this information). Consumers can use the price range filter when searching for businesses on Yelp. The share of different pricing tiers used by consumers in Yelp search results signals their general willingness to spend in various price ranges.
Reservation Booking Days in Advance and Wait Times
We used information from Yelp Guest Manager’s reservations and waitlist services to analyze how far in advance consumers are booking reservations and for how long they are waiting before being seated. Reservation booking days in advance are given as monthly averages, and wait times are given as monthly medians. Data for April 2020 was removed from the graphic due to extenuating circumstances, which created extreme outliers in the dataset that are not representative of changing patterns in consumer behavior.
Electric Vehicle Search Text Mentions
For the data regarding electric vehicle mentions in searches, we measured the share of every million Yelp searches that contained phrases related to electric vehicles or specific models from electric vehicle manufacturers. For “electric vehicle” related searches, we excluded searches that were related to charging stations to better observe interest in the vehicles themselves.
Consumer Interest
We measure consumer interest by looking at select actions users take in connection with businesses on Yelp: such as viewing business pages, or posting photos or reviews.
Changes in consumer interest for each category were measured by comparing year-over-year data from Q2 2019-2022, focusing on each category’s share of all consumer actions in its root category.
Downloadable static graphics can be found here.


