Carl Bialik
Data Editor
October 2019
Q3 2019
Yelp’s measure of the strength of local economies nationwide shows a modest rebound in the third quarter and continued stagnation in the urban centers of California, the nation’s most populous state and biggest economy.
California's position in the national and global economies is strong, as home to one in eight Americans and recently reported as the fifth biggest economy in the world. But the local economies in its major metro areas have been faltering, according to Yelp data.
San Jose and San Francisco have seen the biggest decline in local economic activity among the 50 major U.S. metros we've been tracking since the fourth quarter of 2016, according to the Yelp Economic Average, an economic indicator that uses Yelp data to track the U.S. local economy and 50 top metros around the country in consumer demand and business growth. Among the other California cities we track, San Diego also ranks in the bottom five, while Los Angeles is in the bottom 10 and Sacramento places below average.
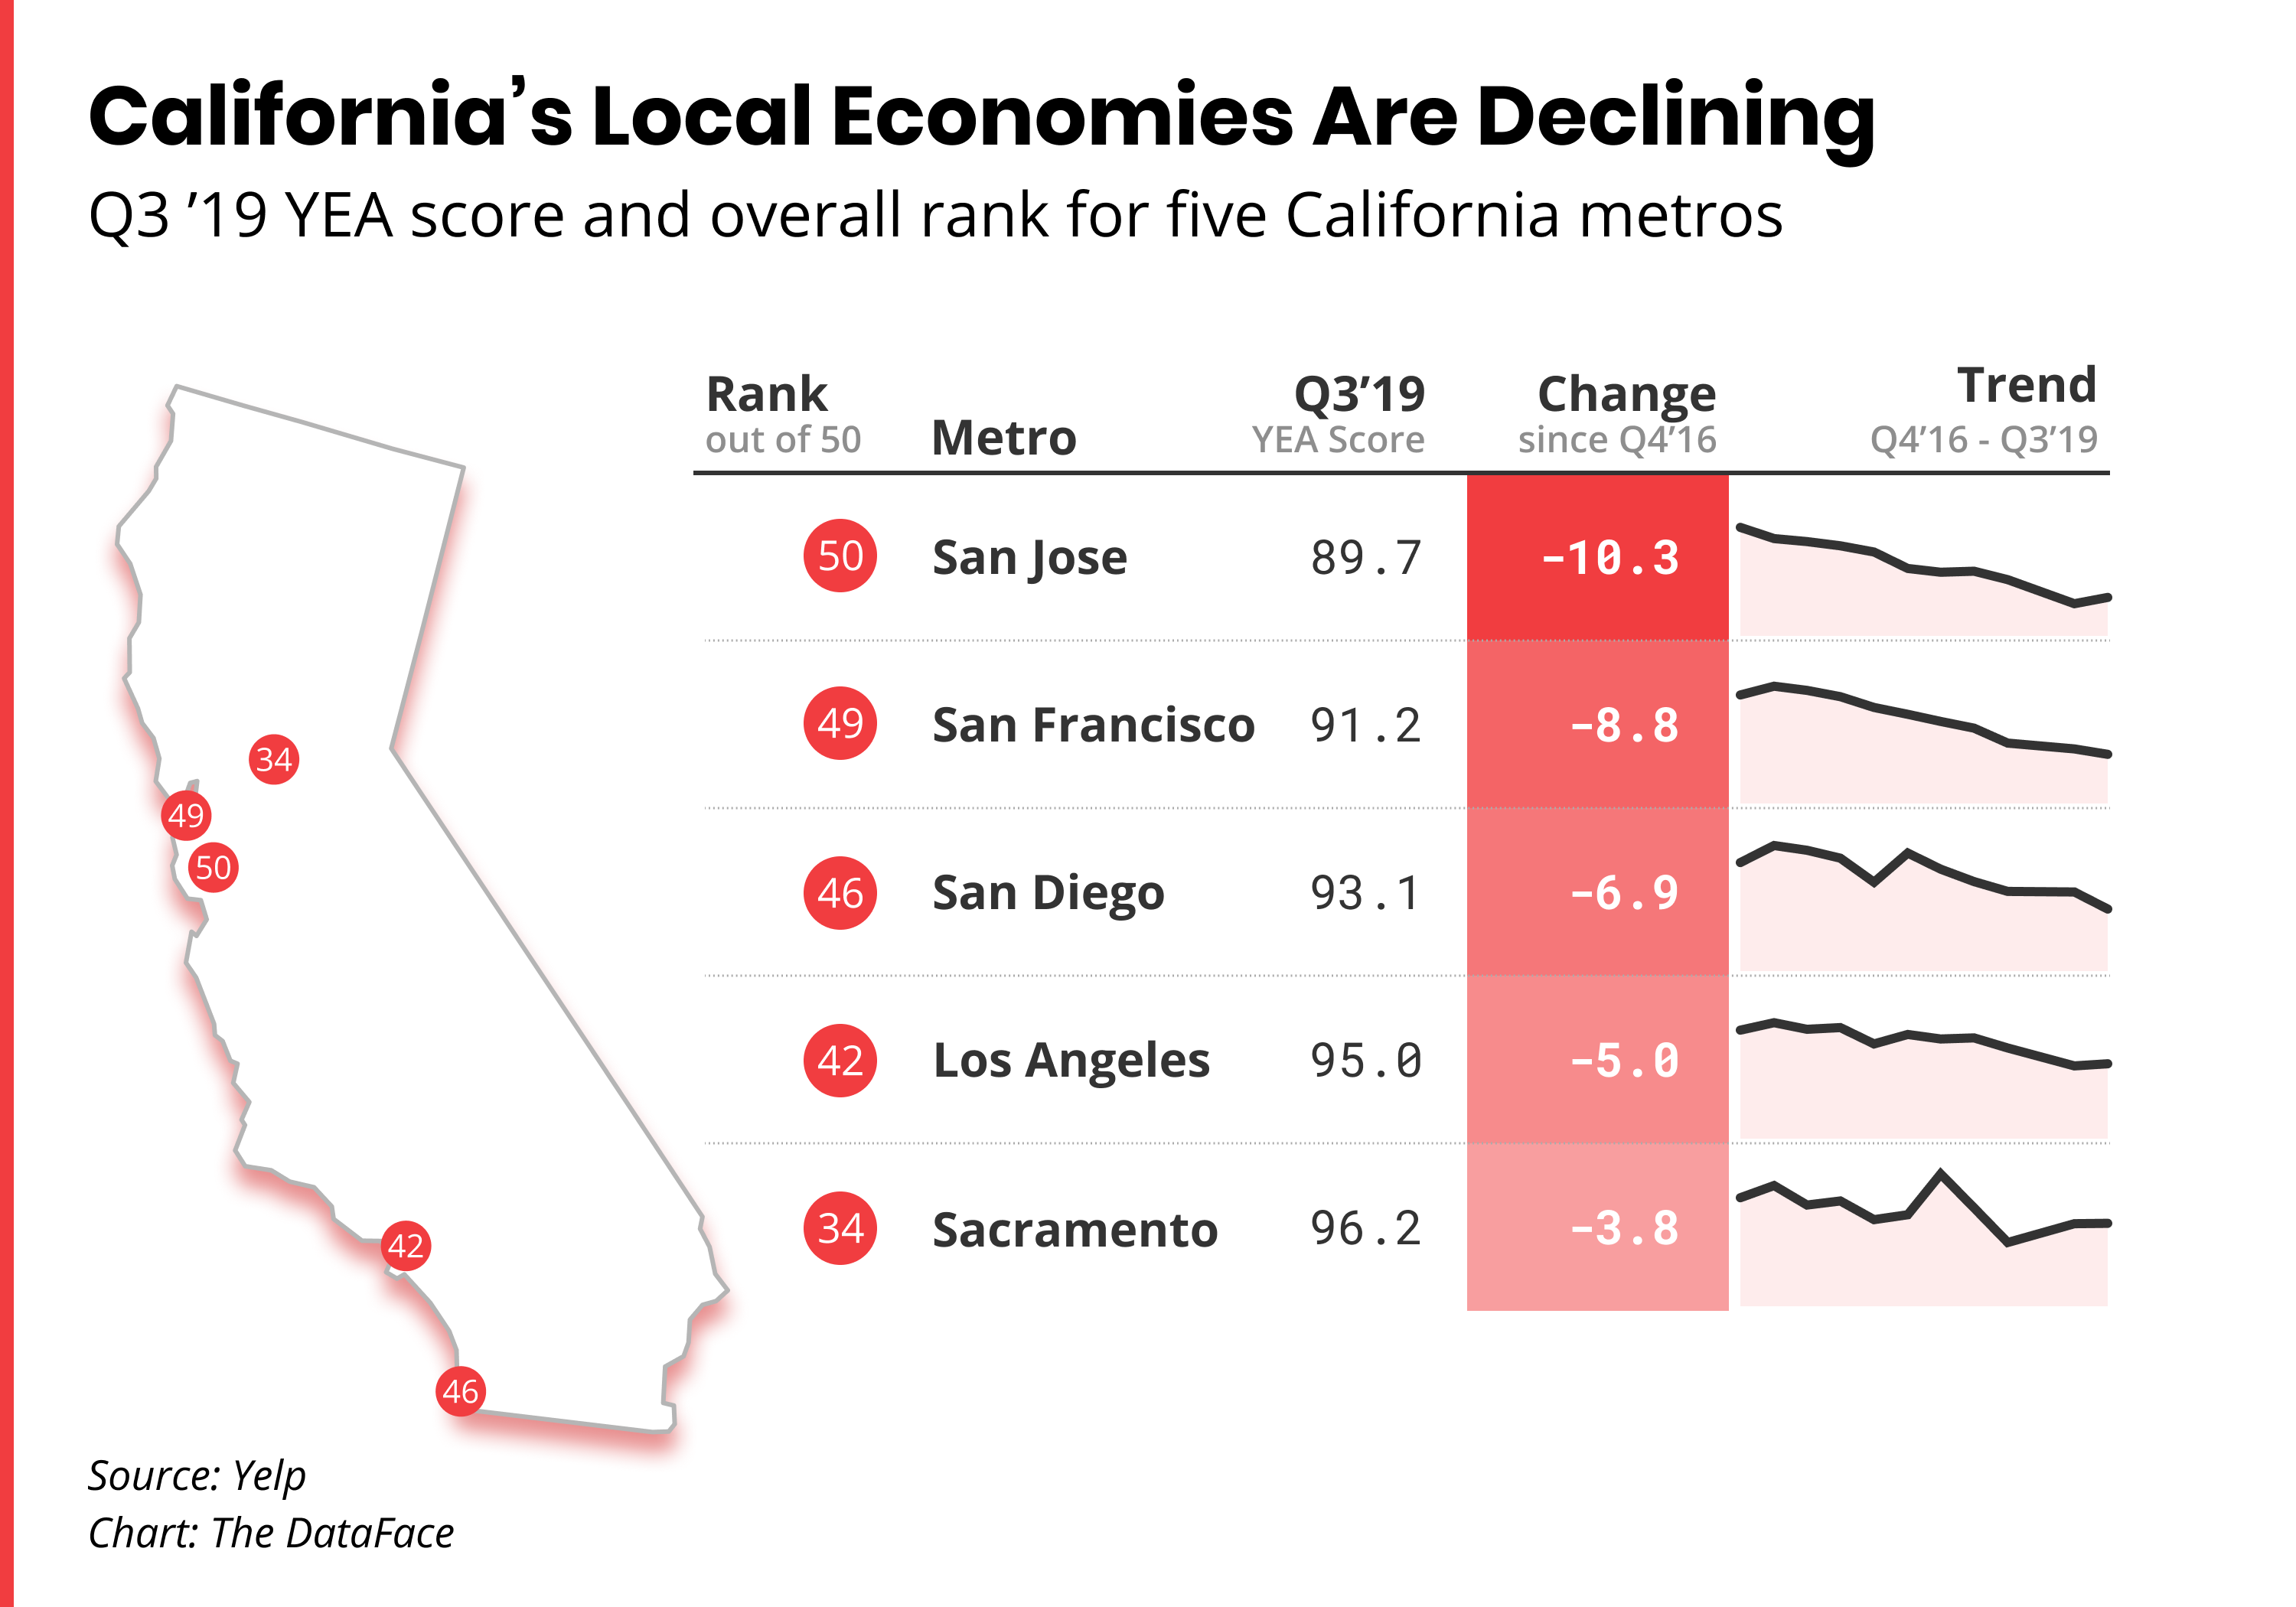
Limits to development around California have driven up housing costs, which has restricted the supply of workers, raised labor costs, and limited consumption because so much income goes to housing, according to the McKinsey Global Institute. Slow growth in density leaves consumers farther from businesses, which could push more shoppers to make more of their purchases online or drive outside metro areas.
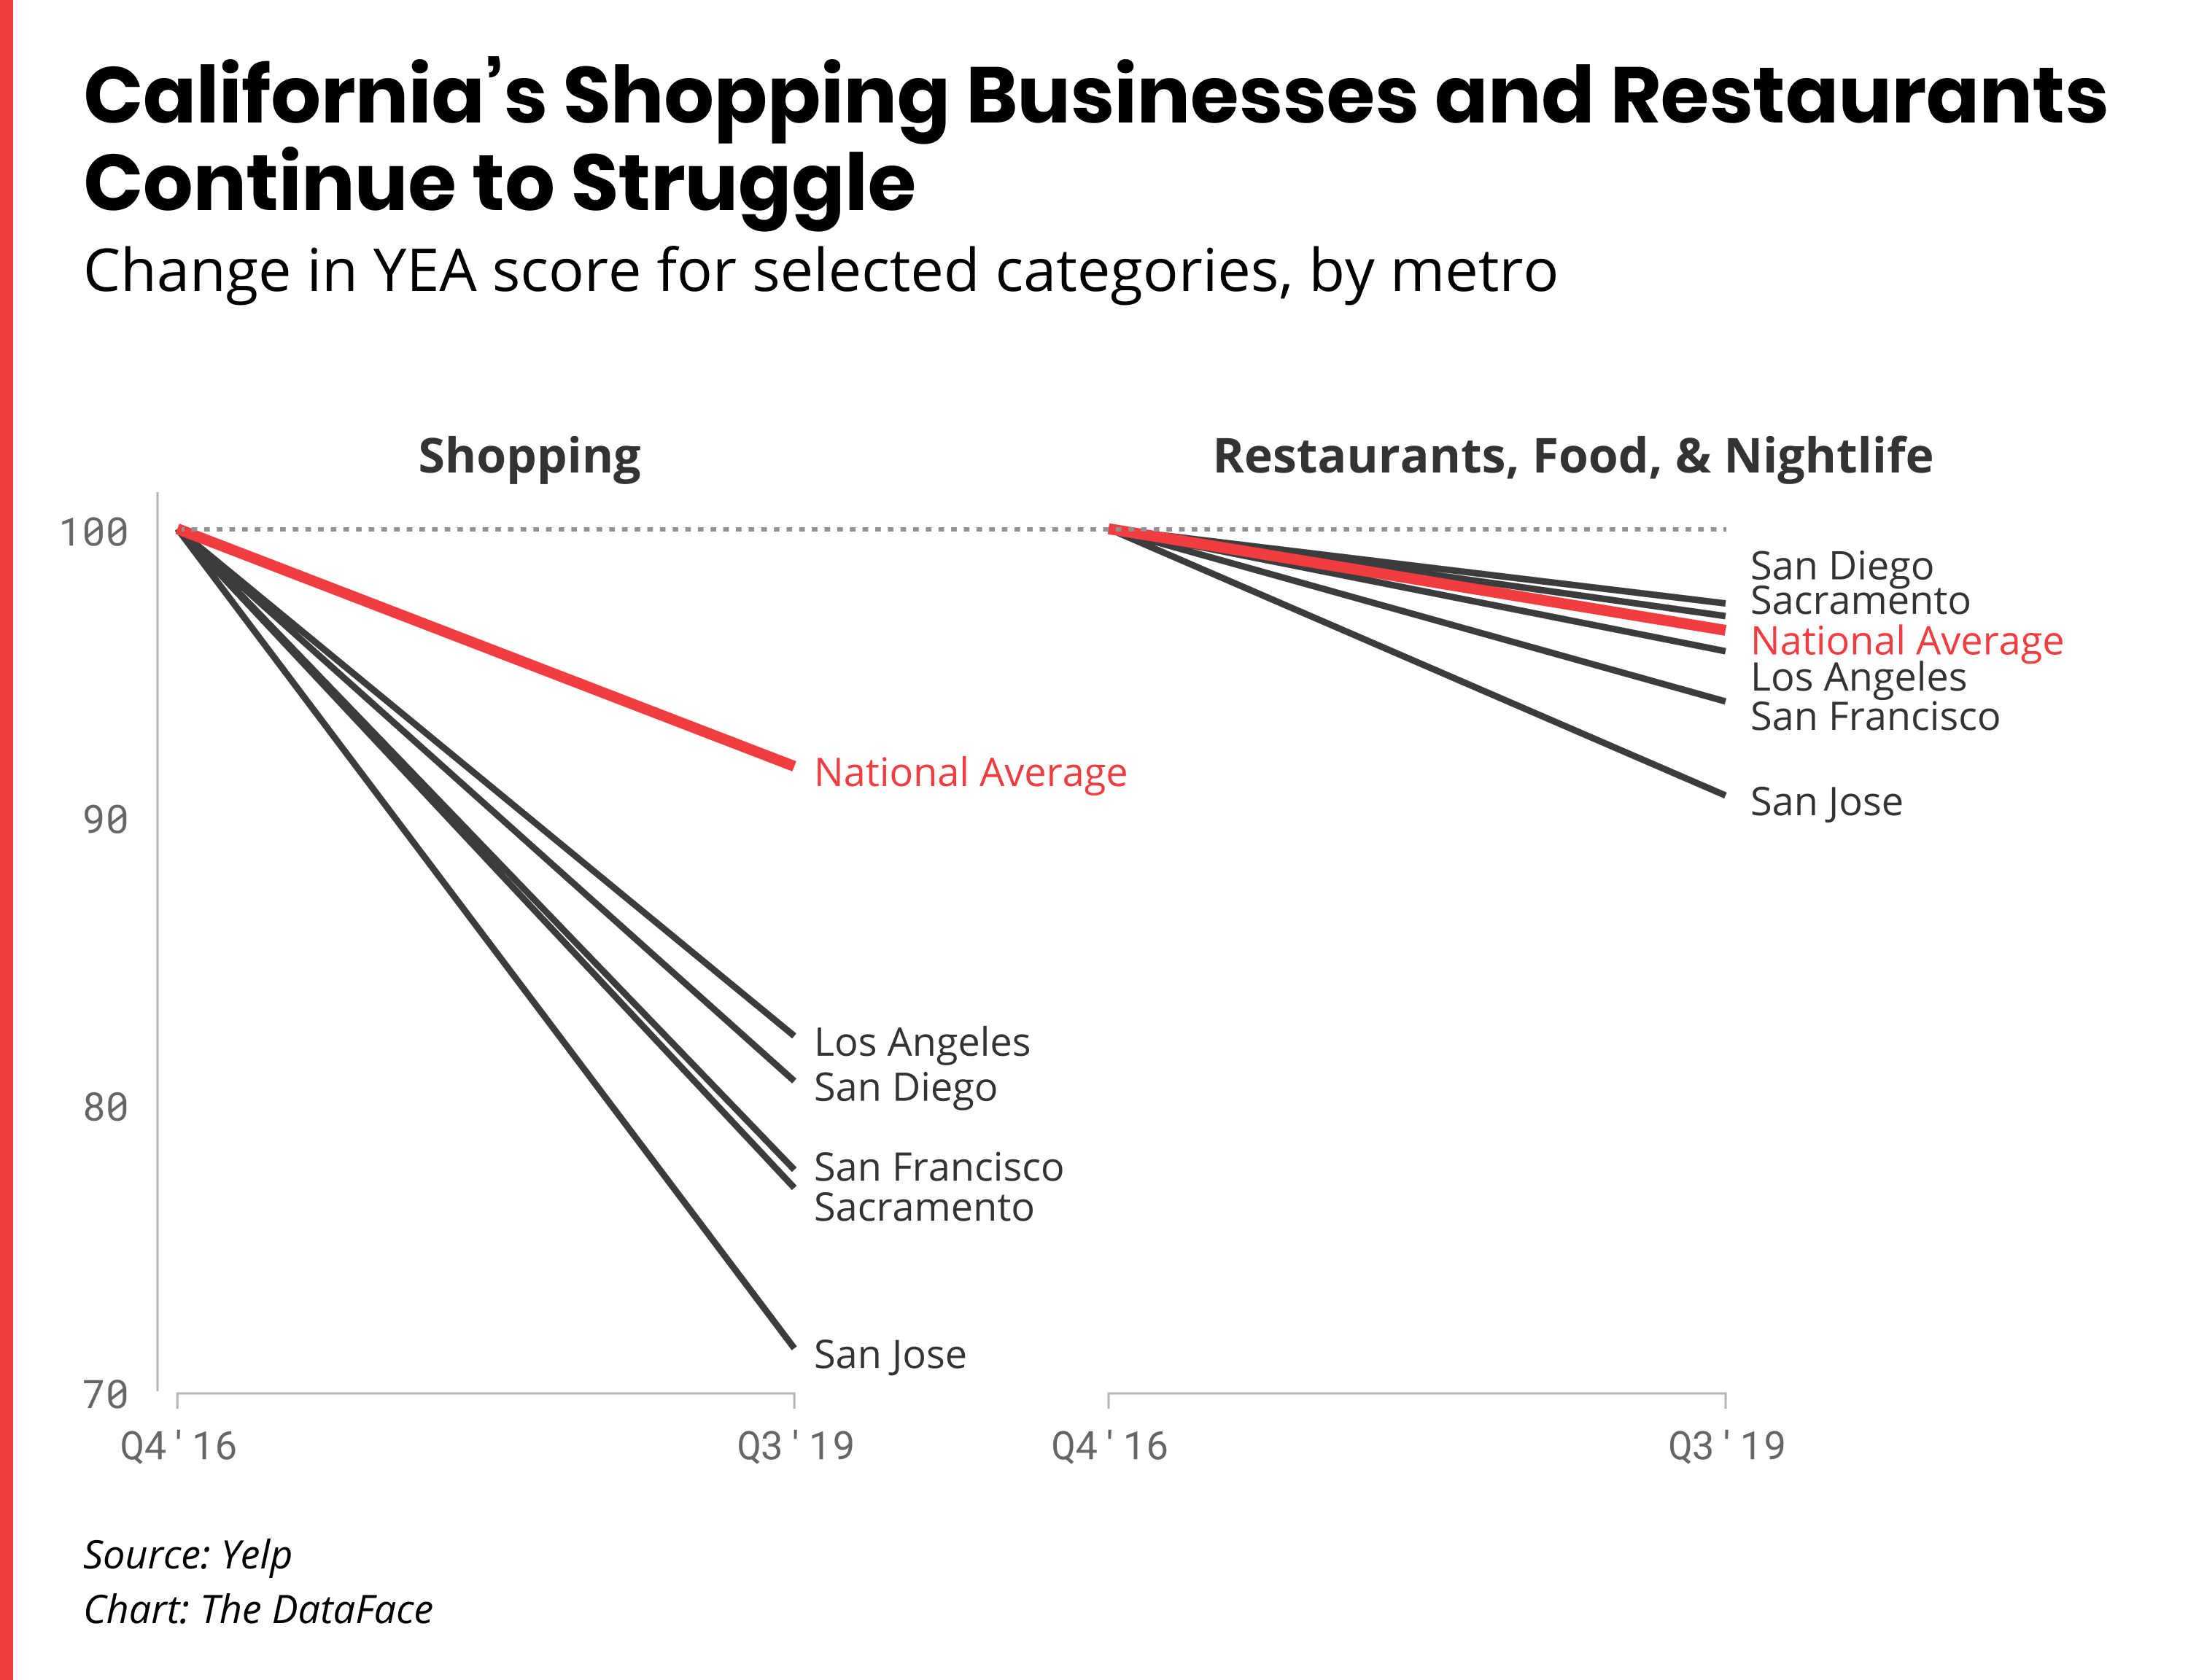
California's shopping businesses have been hit the hardest. Shopping ranks at the bottom in each of the five Golden State metros we track, among the six major sectors of the local economy included in YEA (the other sectors are auto; restaurants, food, and nightlife; professional services; home services; and local services). Stores selling shoes, cellphones, and women's clothing have fallen sharply in all five California metros. Retail rents in San Jose and San Francisco have surged in the last decade. The fate of retail and restaurants is intertwined: Retail stores attract foot traffic which benefits nearby restaurants, and restaurants similarly bring business to neighboring stores. The rise of food-delivery services can separate restaurant customers from after-dinner shopping. And our data bears this out, with restaurants, food, and nightlife categories struggling in all five California cities. The declines range from 2.6% in San Diego to 9.3% in San Jose, with San Francisco near the upper end at 6%.
San Francisco and San Jose have particularly struggled with construction limits and rents, and they’ve consistently ranked as the bottom two metros in the economic average in each of the last three quarters. The other California metros had been doing better at times but have dipped in performance heading into this quarter.
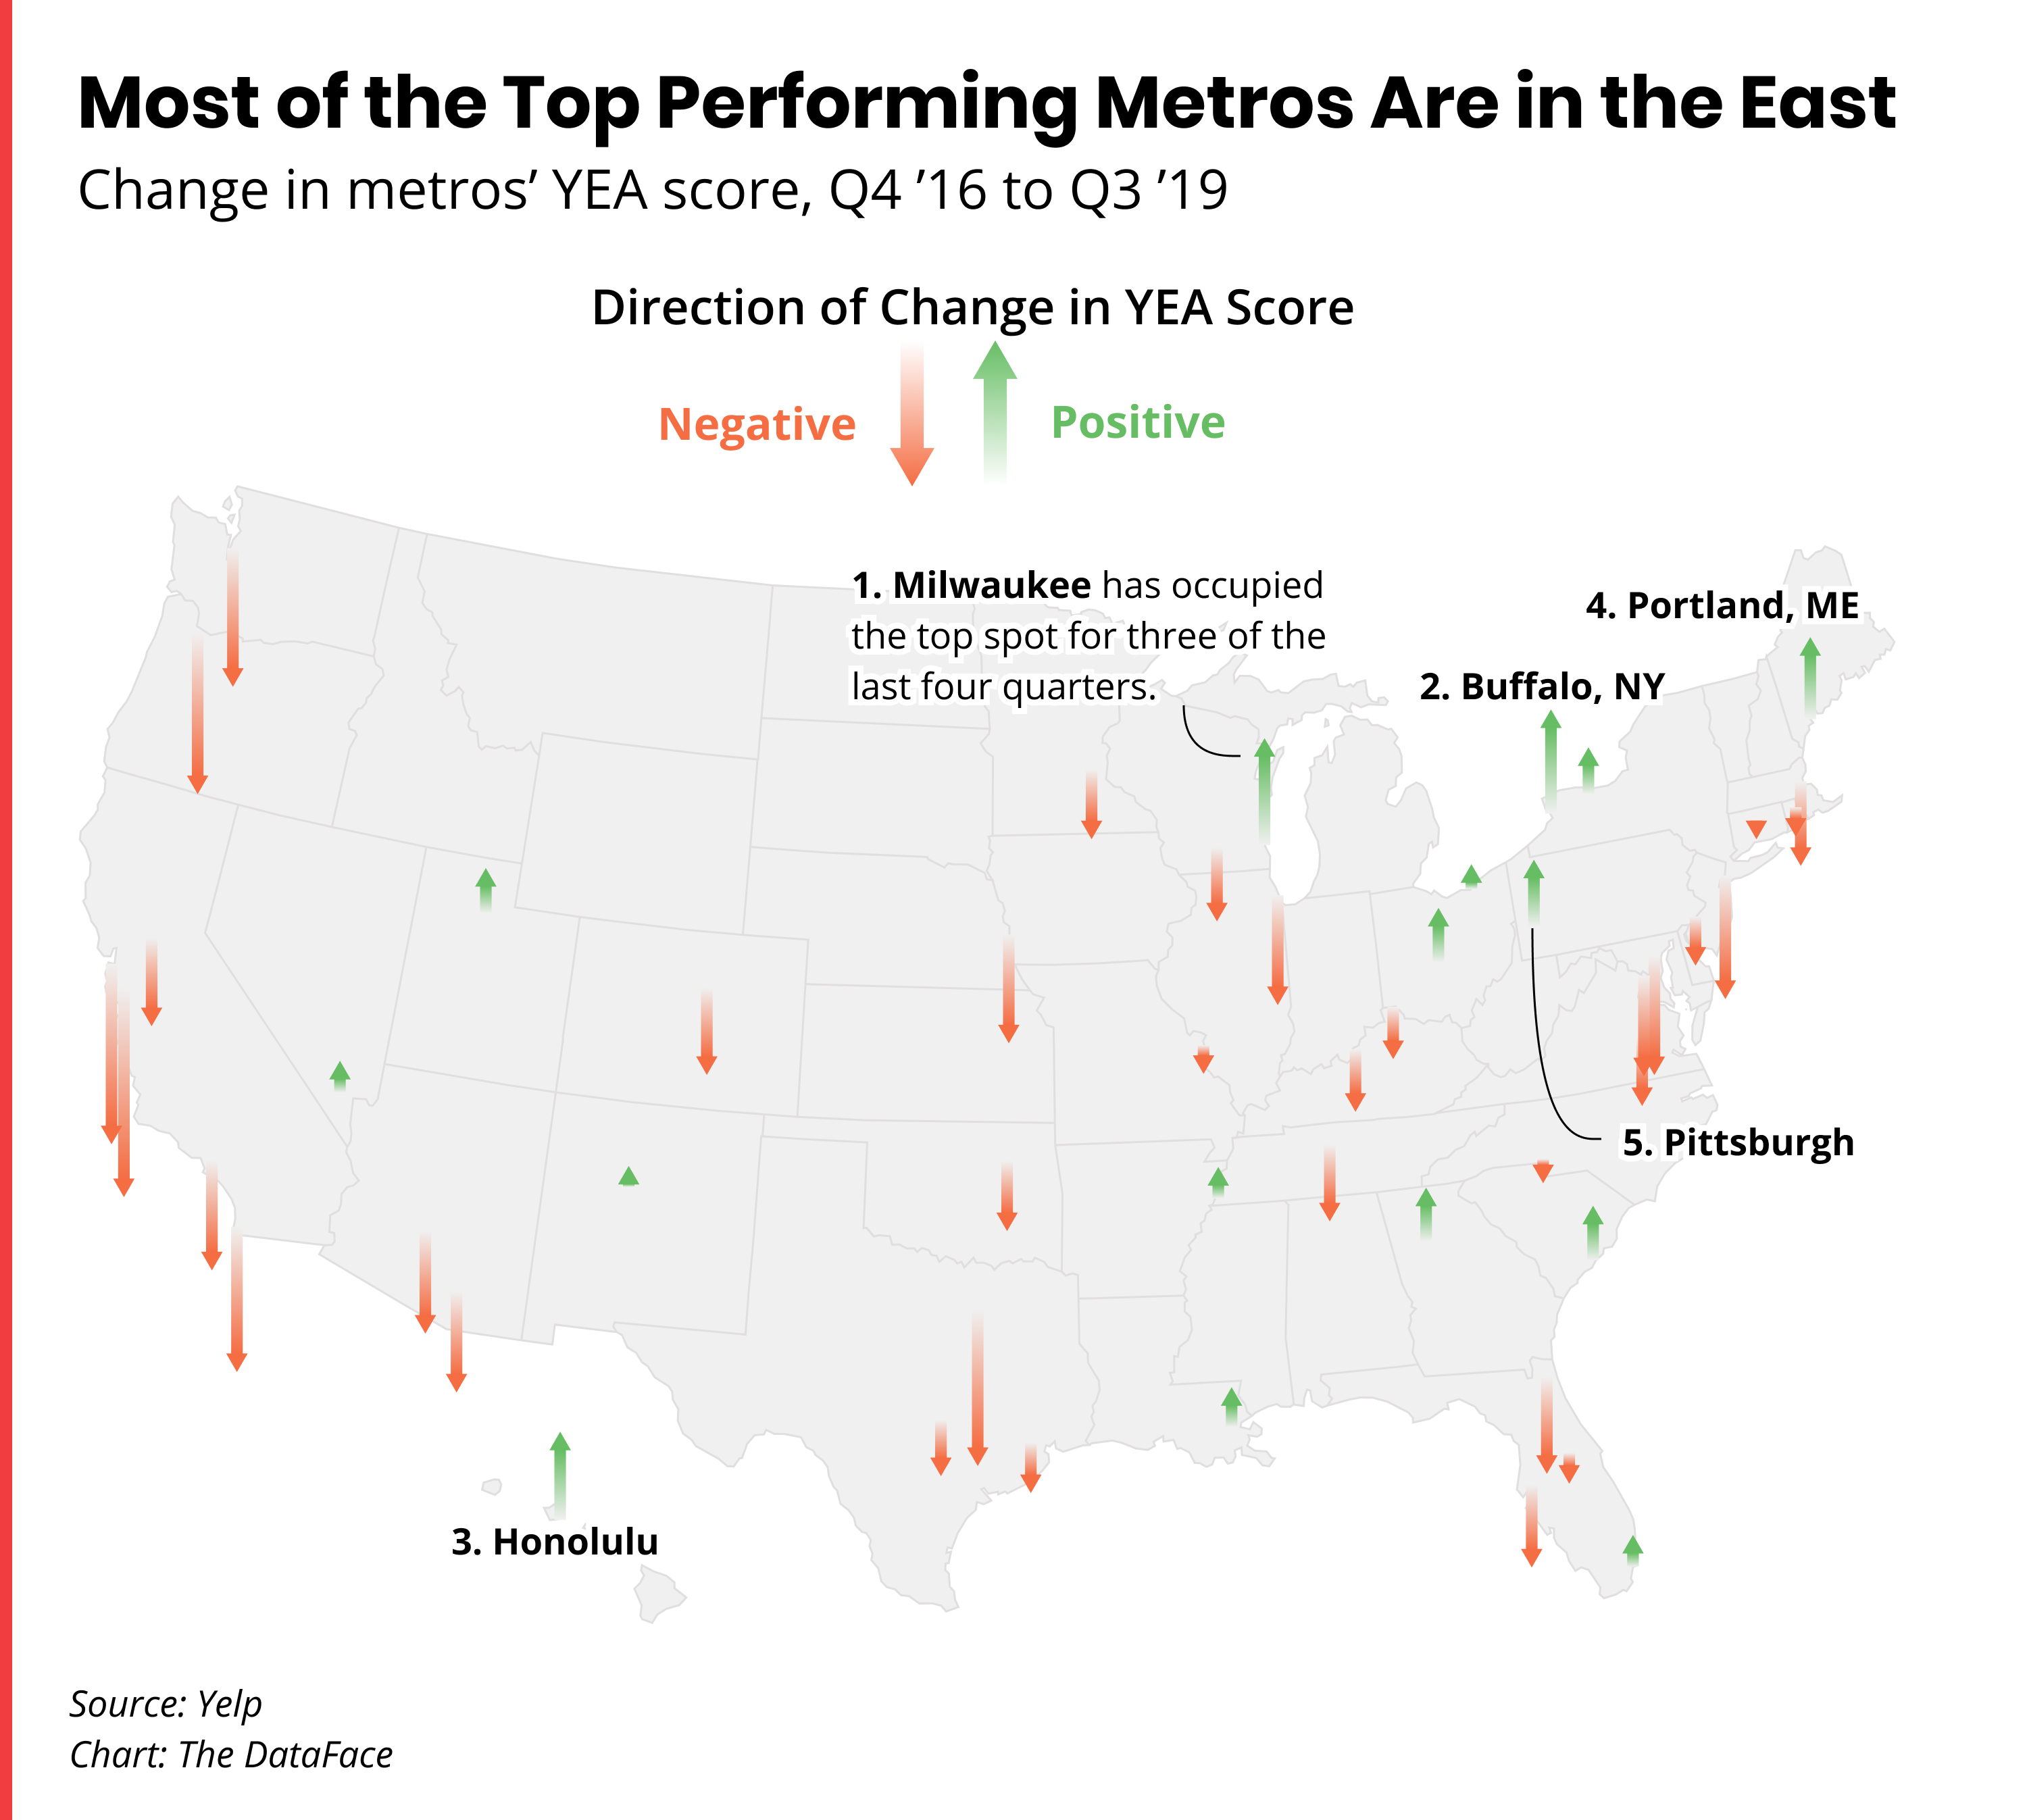
At the top of the YEA metro rankings, three of the boomtowns we identified last quarter remain in the top five: Milwaukee; Honolulu; and Portland, Maine. Joining them are Buffalo and Pittsburgh, knocking out Louisville and Memphis from last quarter.
Home services businesses have been among the strongest in all five of the top metros, indicating the importance of housing and houses to the overall economy.
Local factors also propelled these boomtowns to their success, including food trucks in Milwaukee, life coaches in Buffalo, junk removal in Honolulu, juice bars in Portland, and software developers in Pittsburgh.
Nationally, YEA is up by a hair in the third quarter, just 0.07% above its level in the second quarter, reflecting the sum total of a quarter full of ups and downs, as China trade tensions, Fed deliberations, and impeachment inquiry talk trickles down to Main Street.
Restaurants, Food, and Nightlife
Professional Services
Home Services
Local Services
Automotive
Shopping
As YEA has gone, so has gone the national economy in recent quarters. For every release since we introduced YEA, in January of this year, its change from the prior quarter has matched the change in GDP growth.
Using Yelp’s unique data set, we designed YEA to measure something unlike previous economic indicators: the part of the national economy where business is done locally, near where you live, work or travel. YEA evidence suggests that this important and understudied part of the economy, represented in near-real-time, moves the same way as the economy as a whole.
Yelp has information not only on millions of U.S. brick-and-mortar businesses but on the consumer demand expressed by the millions of consumers who use Yelp every day, which researchers have found makes us well positioned to accurately and quickly measure a huge swath of the economy that is missed by many major indicators.
Behind the local economy’s slender overall movement in the third quarter were lots of shifts within sectors.
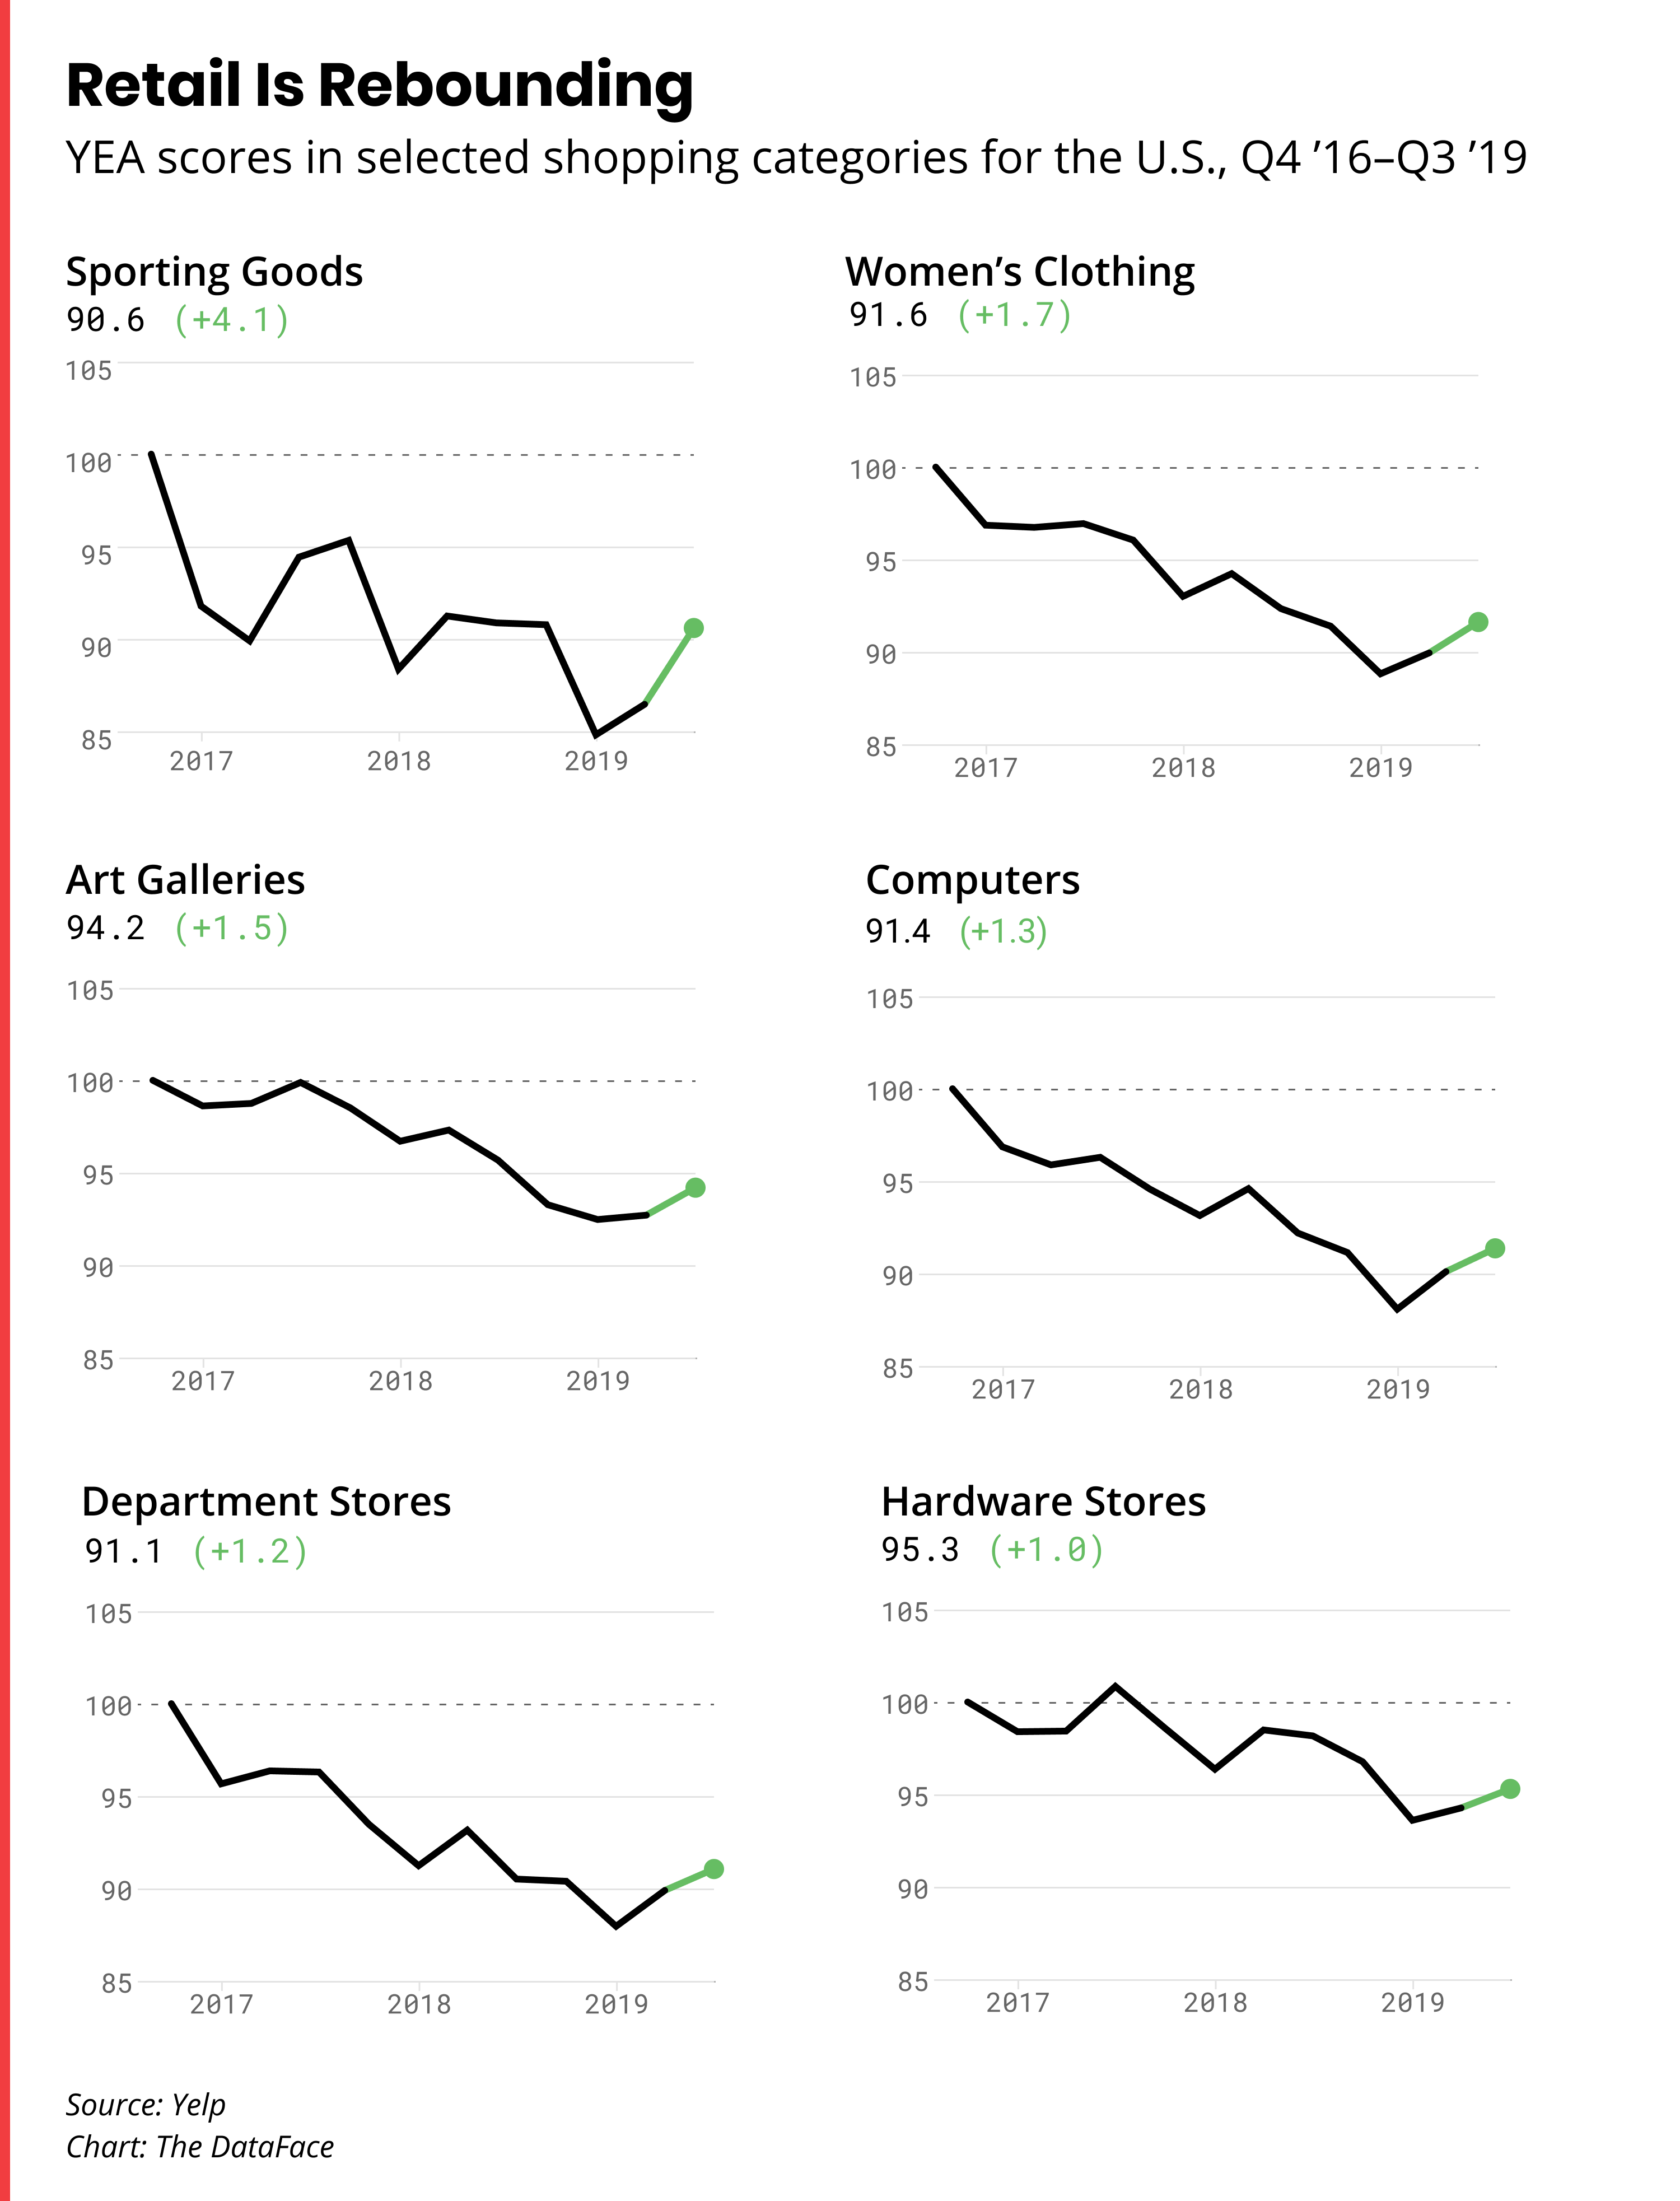
Retail gained ground for a second straight quarter, though it remains far below its level when we started calculating YEA three years ago. Stores selling items that shoppers might want to check out in person were among the gainers: sporting goods, appliances, hardware stores, antiques, furniture stores, and art galleries. Department stores and women’s clothing also advanced. Two types of technology shops that had lost business to online retail—cellphones and computers—made a bit of a comeback.
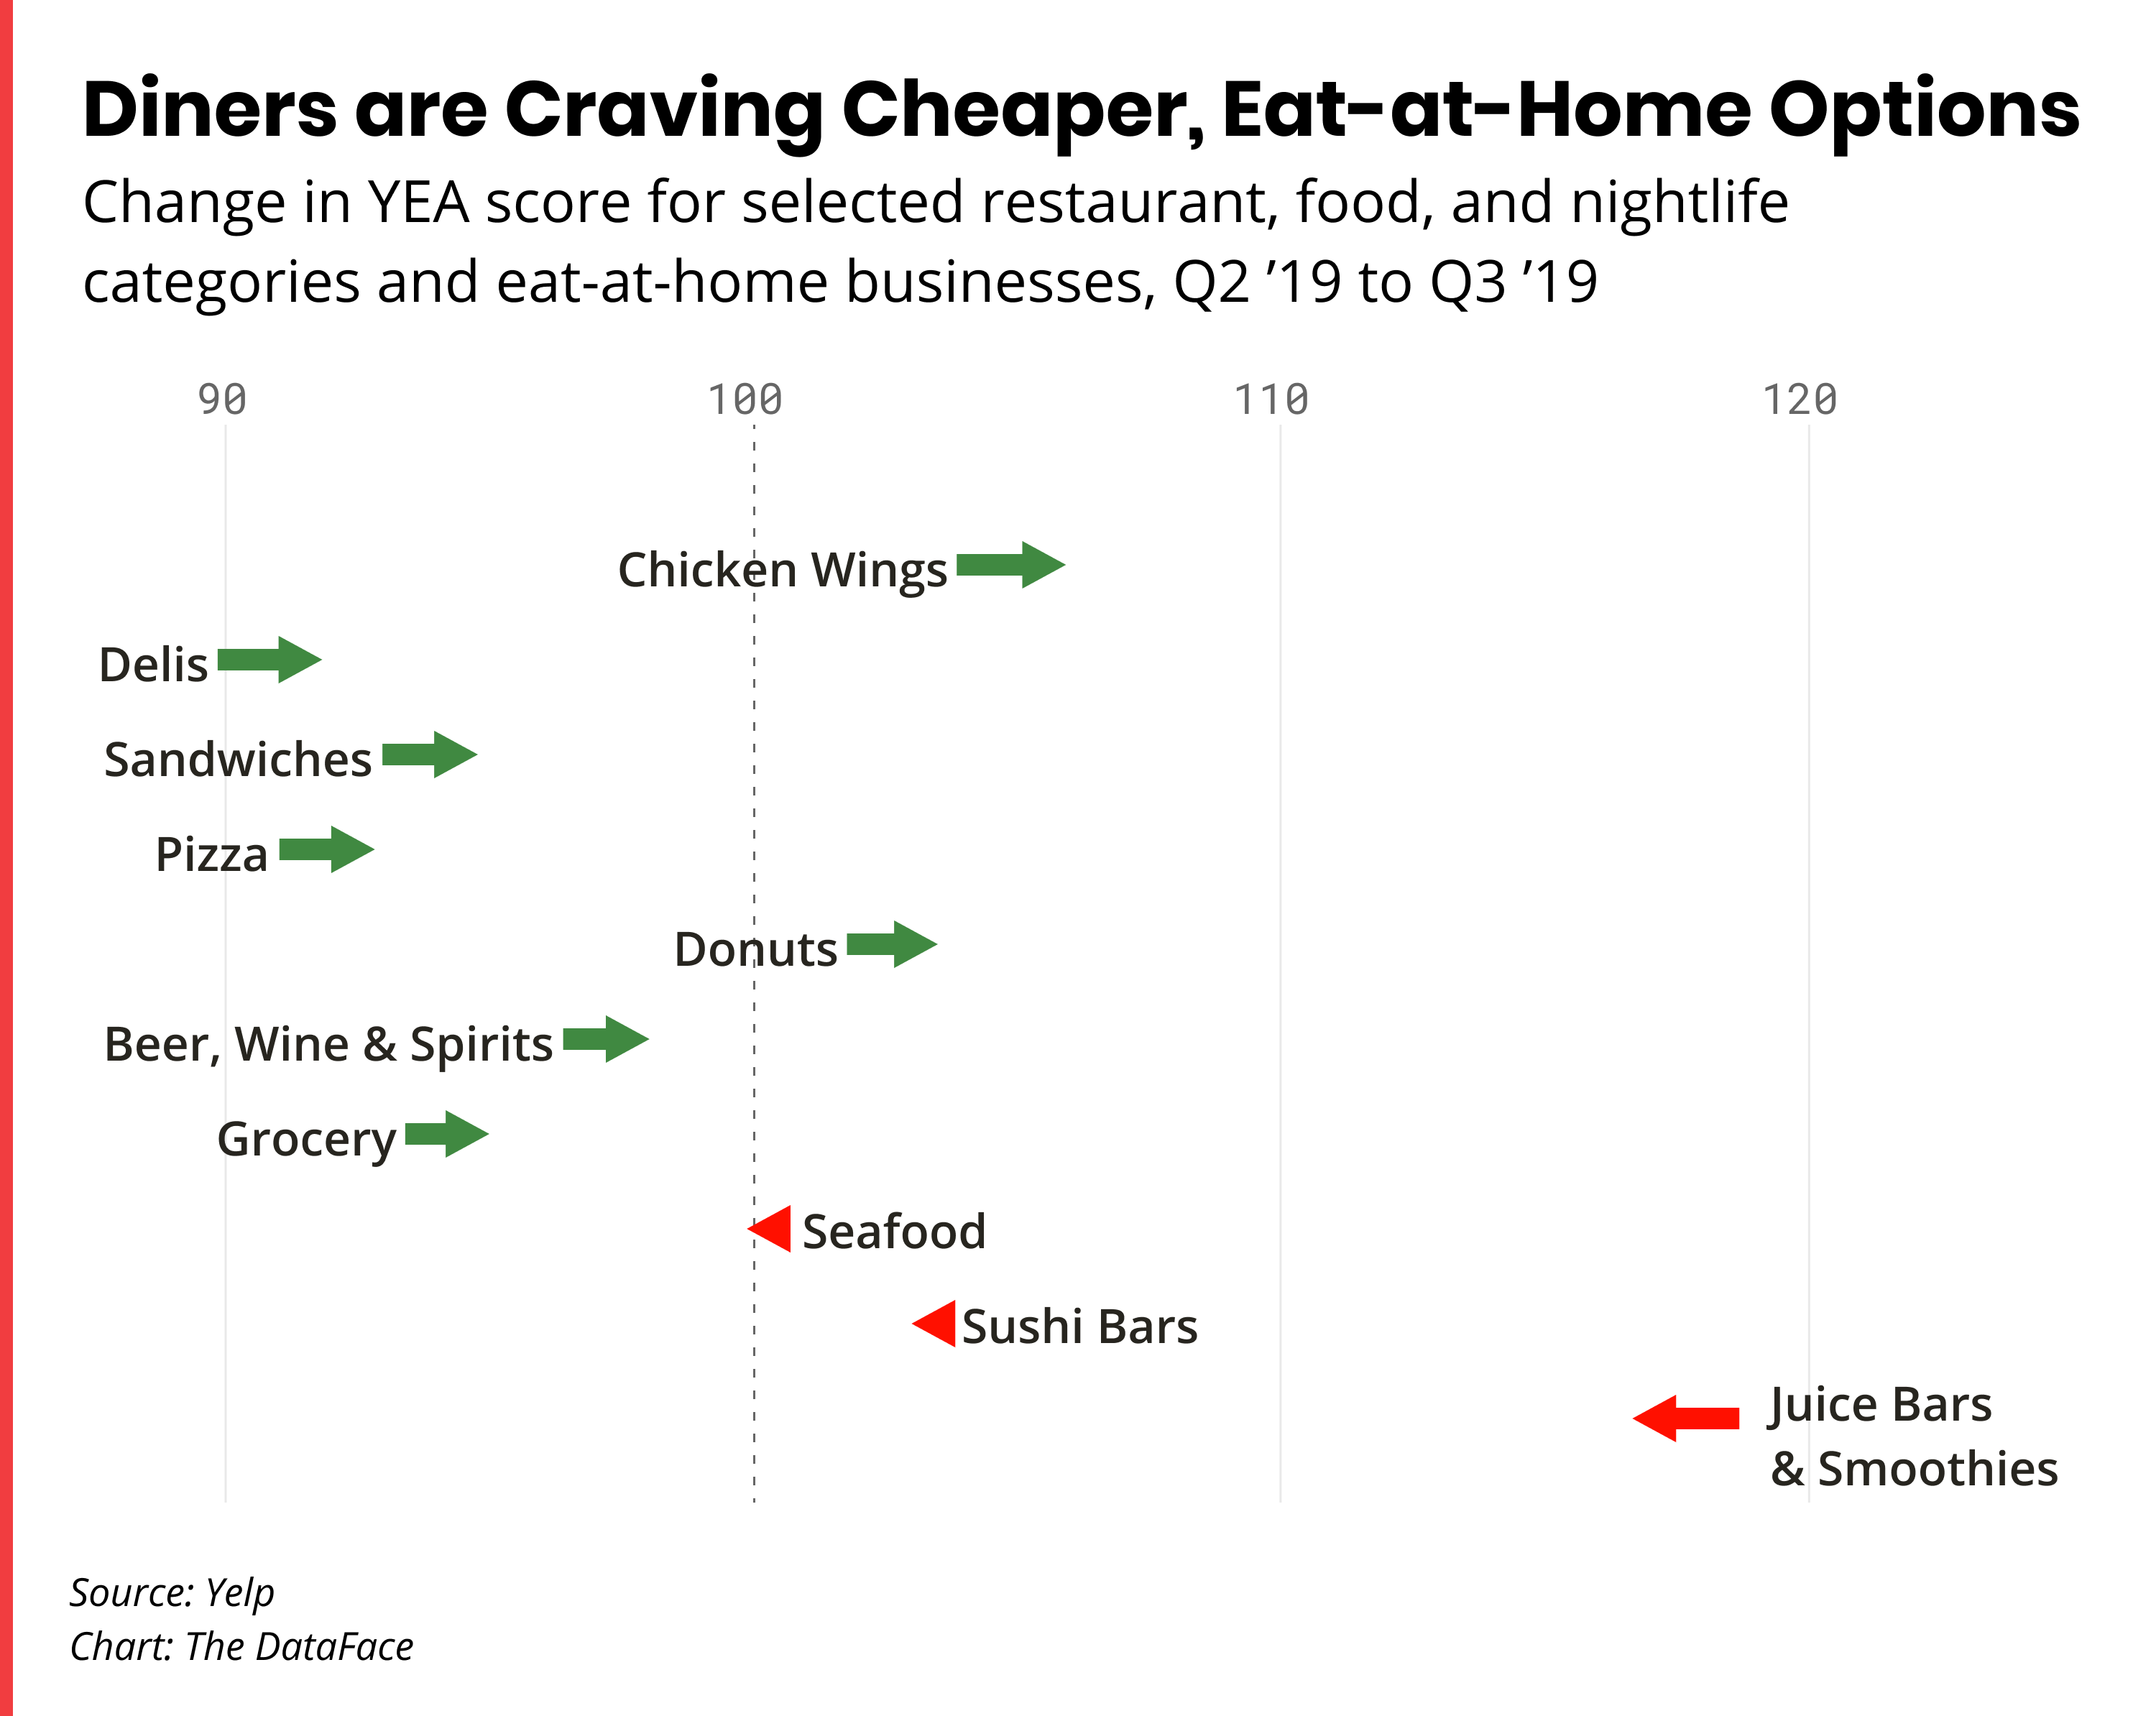
Lower-priced and eat-at-home options were among the strongest in the restaurants, food, and nightlife categories, while several types of upscale restaurants declined, indicating a shift toward value and dining in. The strongest types of food and drink businesses in the third quarter included chicken wings, pizza, and sandwiches; and grocery stores, delis, and stores selling beer, wine, and spirits.
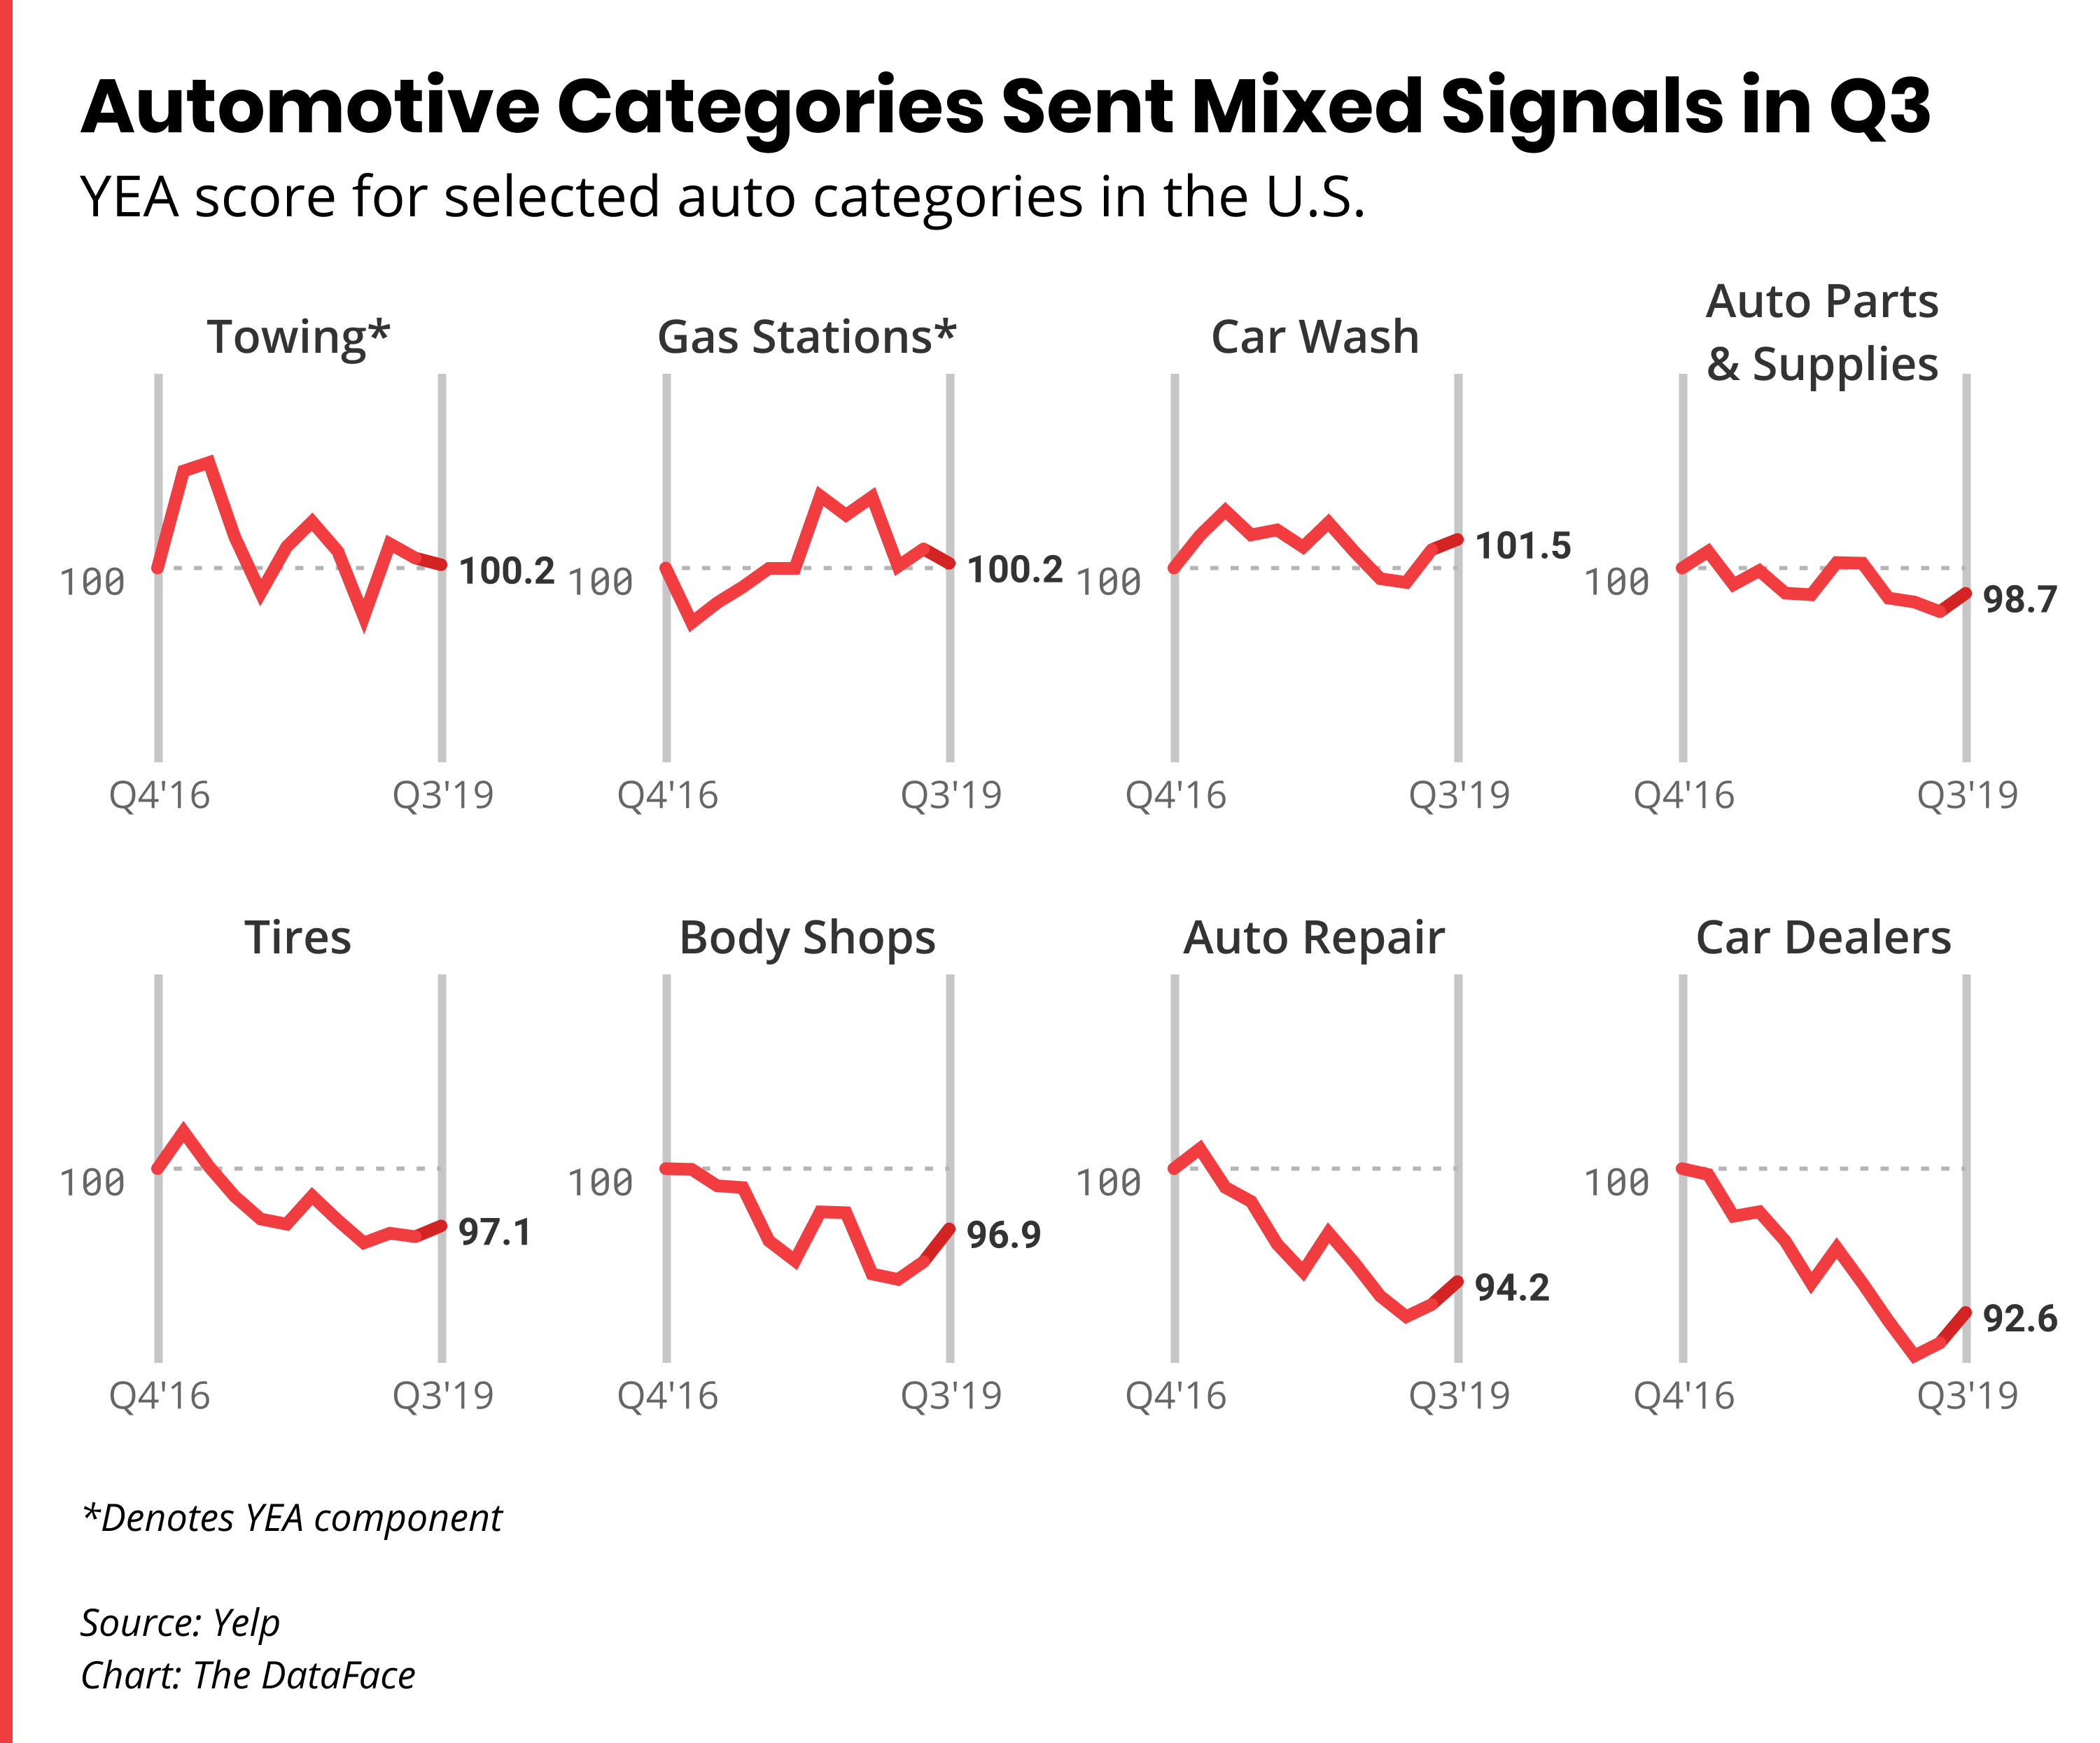
The auto sector sent mixed signals: gas stations fell in the third quarter, but body shops and car dealerships were up. This apparent decoupling of car sales and repairs from fuel sales could signal a shift toward a more fuel-efficient fleet, or a shift toward other modes of transportation, such as flying instead of driving to summer vacation destinations.
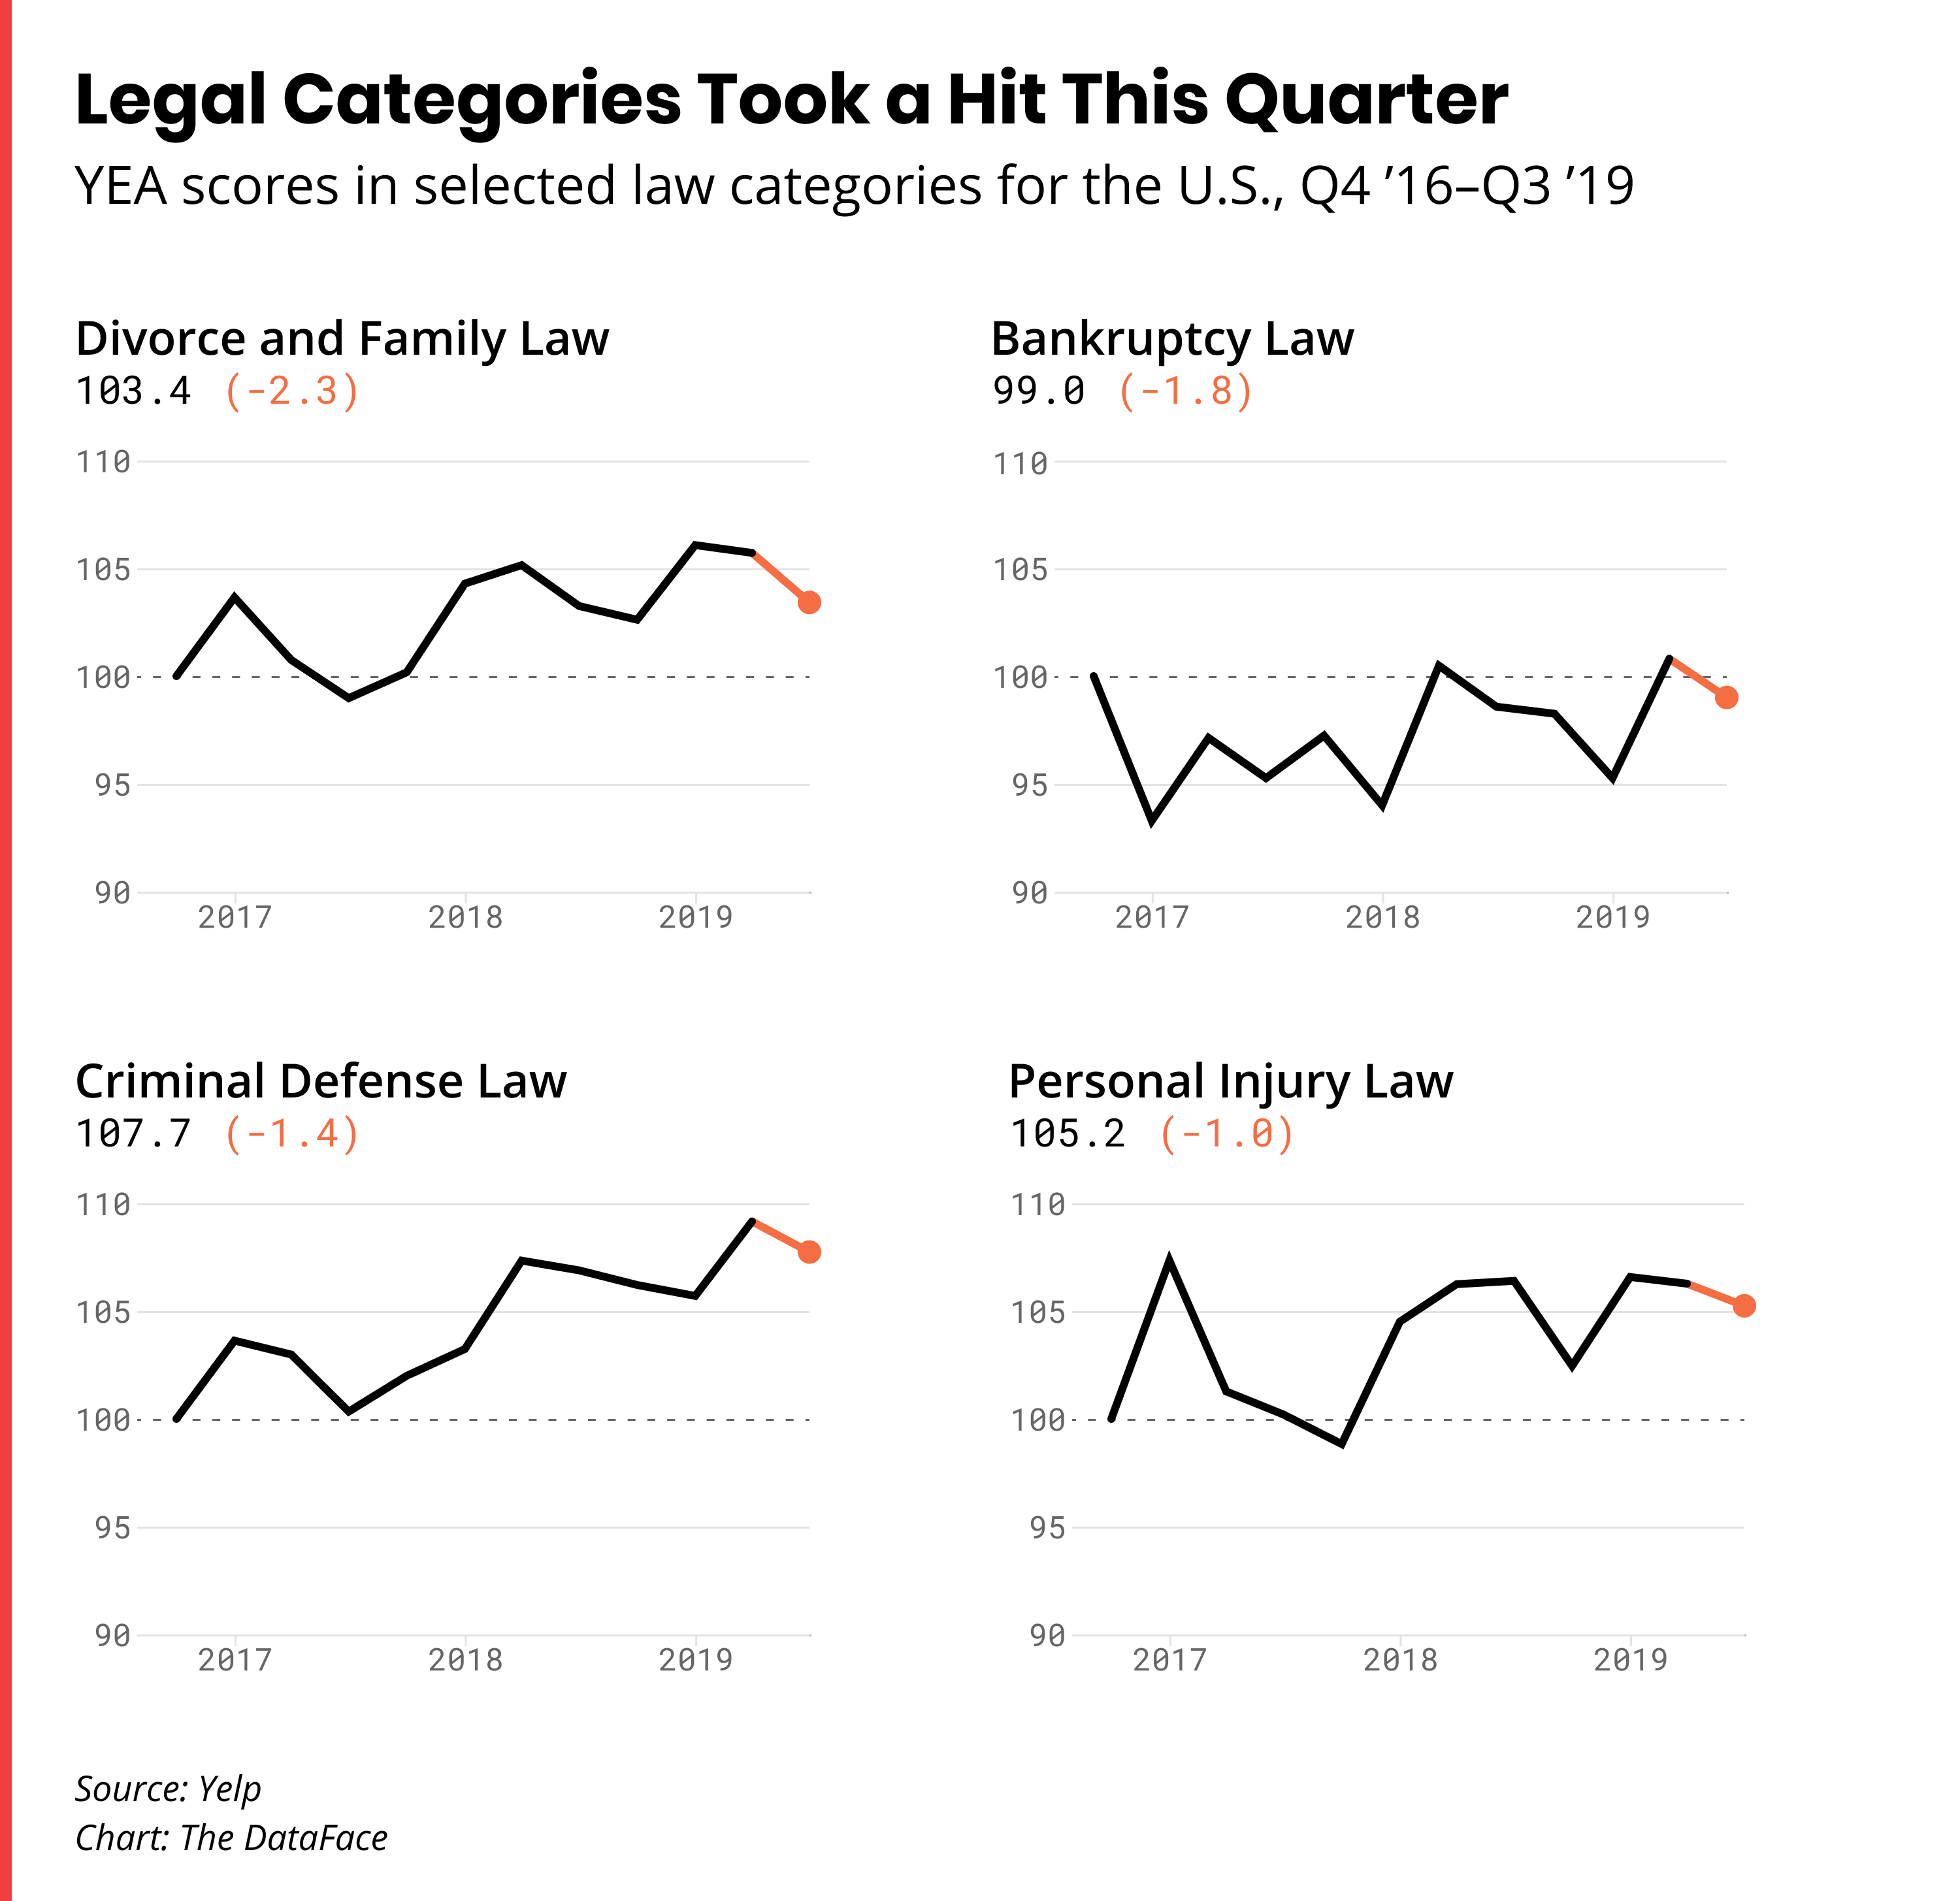
Meanwhile, every category of law we track dropped in the third quarter, including business, immigration, real estate, divorce & family, bankruptcy, criminal defense, and personal injury. Could this be a sign prospective legal clients are shifting from looking for local lawyers to seeking out online services such as Rocket Lawyer and LegalZoom?
Methodology: The Yelp Economic Average (YEA) is a composite measure of the economy, reflecting both business health and consumer demand among businesses in 30 sectors.
The eight root categories
The 30 business sectors, or categories — the "Yelp 30″ — are drawn from eight umbrella business categories on Yelp: restaurants, food, nightlife, local services, automotive, professional services, home services, and shopping.
Root categories' share of the 30 components
The share of YEA components from each of these eight categories is based on each one's share of the economy, as estimated from County Business Patterns reports.
Choosing the Yelp 30
Each of the Yelp 30 is chosen based on maximizing four criteria, relative to other candidates within its family of categories, as measured in the first quarter of 2016:
Choosing baseline categories
We then chose baseline categories against which to compare the fortunes of the Yelp 30. This step helps remove changes due to seasonality and Yelp’s internal growth; what remains is a reflection of real economic patterns. We selected all other root categories not represented by the YEA components as baselines because they provided the most robust controls against seasonality and activity on Yelp.
Calculating the YEA scores
For each of the Yelp 30 in each quarter, its two scores — one for business population and one for consumer interest — are calculated as follows:
Then the two scores are normalized to have the same variance, so that each contributes equally across components.
To reduce the effect of outliers, the overall score for both consumer engagement and business count is the median of each component’s score.
The YEA is the mean of the overall consumer engagement score and business-count score.
The YEA is separate from, and not meant to inform or predict, Yelp’s financial performance because our figures are adjusted to remove the effects of changes to usage of our product.
We calculated equivalent scores at the regional and metro level to provide a local look at the state of the local economy.
Comparing YEA to GDP Growth
We compare the change in both indicators rather than the absolute magnitude because they’re measured and reported differently.